Manufacturing Inventory Management: Best Practices
Practical manufacturing inventory management best practices — covering ABC analysis, MRP, WIP control, safety stock, and the metrics that matter most on the shop floor.
Manufacturing inventory failures tend to be expensive in two directions. Too little inventory and a production line stops — the average mid-size facility loses around $125,000 per hour of unplanned downtime. Too much inventory and carrying costs quietly consume 20–30% of its value every year, tying up capital that could be deployed elsewhere.
Good inventory management is the discipline of staying between those two failure modes — keeping enough stock to maintain production without carrying more than the business actually needs.
Understand the Three Inventory Categories First
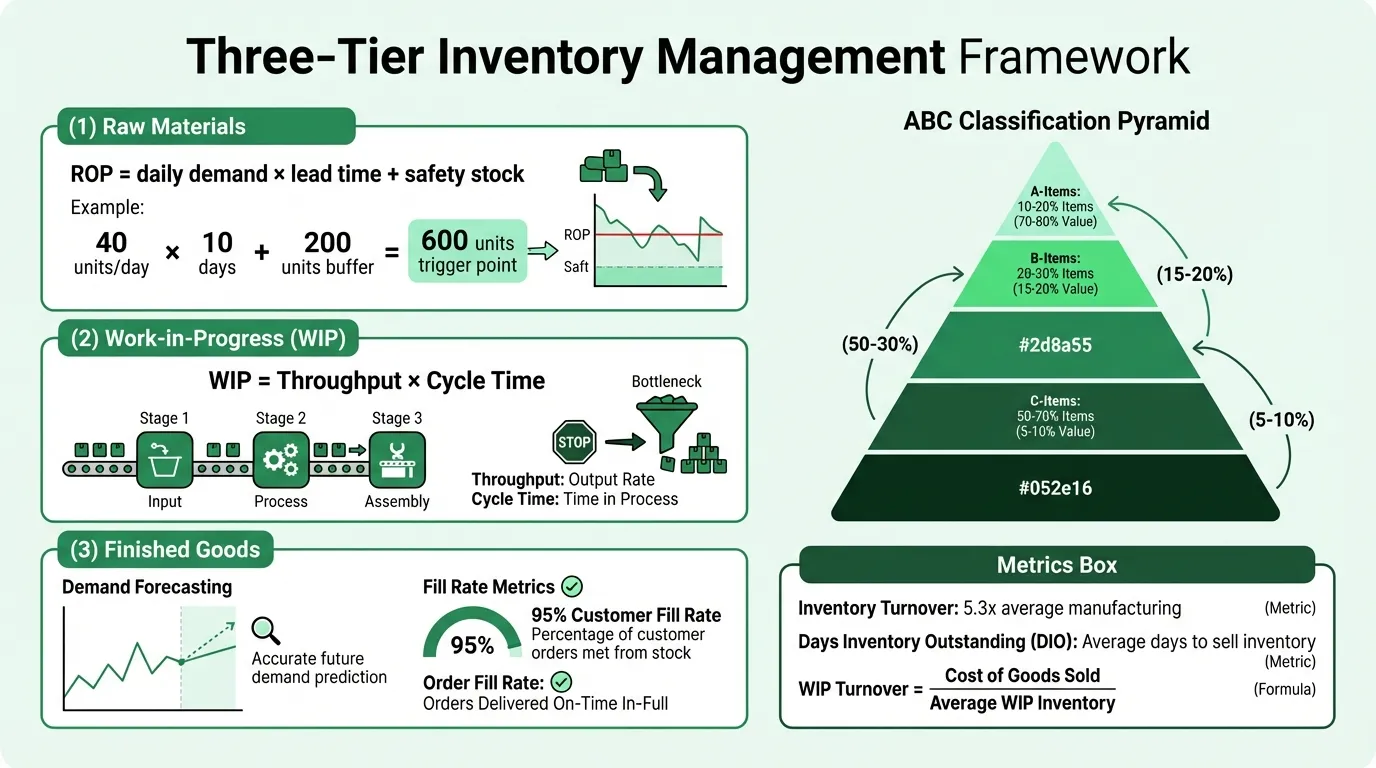
Manufacturing inventory splits into three distinct types, each with different management logic:
Raw materials are purchased inputs that haven't entered production yet. The key challenge is reorder timing: buy too early and carrying costs accumulate; buy too late and production stops.
Work-in-progress (WIP) is inventory currently being transformed on the production floor. WIP isn't just an accounting category — it's a direct signal of production efficiency. High WIP levels indicate bottlenecks or production imbalances. Well-managed manufacturers keep WIP as low as possible consistent with maintaining throughput.
Finished goods are completed products waiting to ship or sell. Managing this category is primarily a demand forecasting problem: overestimate demand and you're holding product that ages or becomes obsolete; underestimate and you miss sales and trigger expediting costs. All three categories appear as separate line items on the manufacturing balance sheet, and their relative movement signals production health.
Each category requires a different approach. Applying raw material logic to WIP management — or finished goods logic to raw materials — creates the wrong controls for the problem.
Apply ABC Analysis Before Anything Else
Not all inventory items are equally important, and treating them as if they are wastes management attention on low-value items while under-managing the ones that actually matter.
ABC analysis classifies SKUs into three tiers by annual consumption value:
- A-items: Roughly 10–20% of SKUs that account for 70–80% of total inventory value. These get tight controls — precise reorder points, frequent cycle counts, close supplier relationships, and careful safety stock calculations.
- B-items: The middle tier. Standard replenishment processes and moderate oversight.
- C-items: The long tail — many SKUs with low individual value. Simpler replenishment rules (fixed order quantities, infrequent counting) are appropriate here.
The manufacturing version of ABC analysis has an important wrinkle: a C-item in terms of cost can be an A-item in terms of production criticality. A $0.08 o-ring that is unavailable stops the entire assembly line the same as a $2,000 subassembly shortage. For production-critical low-cost components, maintain a separate "criticality" classification alongside the value-based ABC tiers. Items that are low-cost but high-criticality warrant safety stock buffers even if their annual spend doesn't justify it by value alone.
Set Reorder Points Using Actual Lead Time Data
A reorder point (ROP) is the on-hand quantity that triggers a new purchase order — set correctly, the new shipment arrives just as your buffer is consumed. Set incorrectly, you either hold excess stock or create stockouts.
The formula:
ROP = (Average daily demand × Supplier lead time in days) + Safety stock
Example: You consume 40 units of a component per day on average. Your supplier delivers in 10 days. You want 5 days of safety stock.
ROP = (40 × 10) + (40 × 5) = 400 + 200 = 600 units
When on-hand inventory reaches 600 units, you place the order. By the time the shipment arrives 10 days later, you'll have approximately 200 units remaining — your safety stock buffer.
Two errors consistently undermine this system. First, using best-case lead time instead of average lead time. If your supplier usually delivers in 10 days but occasionally takes 14, use the average (and inflate safety stock to cover the tail risk). Second, setting ROPs once and not updating them when production volumes change or seasonality shifts demand.
Control WIP with Hard Limits
Work-in-progress inventory that builds up on the production floor is a symptom, not a feature. It signals that production stages are running at different rates — some faster than others — and that half-finished product is queuing at the bottleneck.
The conceptual tool here is Little's Law: WIP = Throughput Rate × Cycle Time. If you want less WIP, you either need to reduce cycle time (process faster) or reduce throughput entering the system at the front. The practical implication is that you cannot reduce WIP by ordering faster upstream — you reduce it by addressing the constraint downstream.
Two operational approaches:
Kanban systems impose hard WIP caps between production stages. Each stage only produces when a signal (physical card, digital trigger) indicates that downstream capacity is available. Without a signal, production at that stage stops. This prevents the natural tendency to "keep busy" by producing inventory that downstream can't absorb.
Theory of Constraints (TOC) scheduling identifies the single bottleneck resource in the production system and subordinates all other scheduling decisions to that constraint. Production before the bottleneck is deliberately slowed to prevent WIP pileup. Production after the bottleneck is maximized to ensure output isn't wasted.
Track WIP turnover: WIP Turnover = Cost of Goods Manufactured ÷ Average WIP Inventory. A declining ratio over time tells you WIP is accumulating relative to output — the right signal to investigate bottlenecks. The manufacturing income statement shows how WIP changes flow through the COGM schedule and ultimately into COGS.
Use MRP for Raw Material Planning
For manufacturers with complex products — multi-level bills of materials, long-lead-time components, or make-to-order environments — Material Requirements Planning (MRP) provides the systematic backbone for purchasing decisions.
MRP works from three inputs:
- Master Production Schedule (MPS): What finished goods need to be produced, and when.
- Bill of Materials (BOM): The complete recipe of every component, subassembly, and raw material required per unit.
- Inventory Status File: Current on-hand quantities plus open purchase orders and work orders.
The system "explodes" the MPS through the BOM to calculate gross component requirements at every level of the product structure, then nets out current stock and inbound orders to produce time-phased purchase orders and production work orders.
The output quality is limited by the input quality. An MPS built on an overoptimistic sales forecast generates excess component purchases. A BOM with incorrect quantities produces chronic shortages or overstocking of specific components. A stale inventory status file — reflecting what the system thinks is on hand rather than what's actually there — triggers phantom orders.
MRP is a planning tool, not a substitute for physical inventory accuracy. Average inventory record accuracy across manufacturing is around 83% — below the 90%+ threshold needed for MRP to function reliably. Before relying on MRP outputs, manufacturers need cycle counting programs that keep physical counts aligned with system records.

Need a ready-made expense tracker template for your manufacturing?
Download a pre-built spreadsheet with industry-specific categories, formulas, and formatting.
Calculate Safety Stock for Critical Components
Safety stock isn't a gut-feel buffer — for your most critical components, it should be calculated from supplier lead time variability and demand variability.
Practical formula (no statistics required):
Safety Stock = (Maximum daily demand − Average daily demand) × Maximum lead time in days
Example: You use 35 units per day on average, but volume can hit 50 units during production peaks. Your supplier usually delivers in 8 days but has taken 12 days.
Safety Stock = (50 − 35) × 12 = 180 units
For A-items and production-critical components, invest in the more rigorous statistical calculation. Multiply the Z-score for your target service level (1.65 for 95%, 2.05 for 98%) by the standard deviation of demand during lead time. The more precise figure matters most when carrying costs are high or supplier reliability is variable.
Carrying costs running at 20–30% of inventory value annually means that excess safety stock has a measurable carrying cost. Calibrate safety stock levels to actual supplier performance data, not static rules of thumb. Use our manufacturing cash flow calculator to see how safety stock decisions affect your monthly cash position.
Replace Annual Counts with Cycle Counting
Annual physical inventory counts give you accurate data once per year. Discrepancies found during the count may have been running for 6–11 months before discovery. By the time you identify that 800 units of a component are unaccounted for, you've already been reordering incorrectly for most of the year.
Cycle counting solves this by distributing counts continuously:
- Divide inventory into segments (by ABC tier, by storage location, by component type)
- Count different segments on a rotating schedule — daily, weekly, or monthly depending on item importance
- Reconcile discrepancies immediately, before they compound
A-items warrant monthly counts. B-items can be counted quarterly. C-items twice a year is typically sufficient.
Cycle counting keeps inventory records aligned with physical reality, which directly improves MRP output quality. It also catches shrinkage, receiving errors, and miscounts in weeks rather than months.
Monitor the Metrics That Signal Problems Early
Inventory management decisions need feedback loops. These are the manufacturing-specific metrics worth tracking consistently:
| Metric | Formula | What It Reveals |
|---|---|---|
| Inventory Turnover | COGS ÷ Average Inventory | How efficiently total inventory converts to production and sales |
| Days Inventory Outstanding (DIO) | (Avg Inventory ÷ COGS) × 365 | Average days inventory sits before being used or sold |
| WIP Turnover | Cost of Goods Manufactured ÷ Avg WIP | Speed at which WIP moves through production |
| Fill Rate | Orders Filled from Stock ÷ Total Orders | Ability to fulfill orders without backorders |
| Carrying Cost % | Total Holding Costs ÷ Avg Inventory Value | Annual cost of holding inventory as % of value |
| Forecast Accuracy | (1 − | Actual − Forecast |
| Backorder Rate | Orders on Backorder ÷ Total Orders | Frequency of unfulfilled demand |
| Obsolescence Rate | Unsellable Goods ÷ Total Goods | Share of inventory that requires write-off |
Tracking these metrics individually matters less than watching the trends over time. A fill rate dropping from 94% to 89% over three months tells you something is changing in your supply chain before customers start calling with complaints. A rising DIO while turnover stays flat signals finished goods accumulation.
For manufacturers tracking financial performance alongside operational metrics, the Manufacturing Income Statement Template and Manufacturing KPI Dashboard provide structured formats for connecting inventory performance to gross margin, COGS, and overall profitability.
Address Forecast Accuracy as an Upstream Problem
Most inventory problems are downstream consequences of forecast inaccuracy. MRP generates purchase orders based on expected future demand — if the forecast overstates demand by 20%, the system plans 20% more material than is needed. The result is excess raw material stock, potentially excess WIP, and finished goods that accumulate rather than ship.
Improving forecast accuracy requires cross-functional input: sales knows which customers are likely to pull forward or delay orders, operations knows which production constraints limit what's achievable, and finance knows which products are most sensitive to cost variance. Companies that run a formal Sales and Operations Planning (S&OP) process — producing a single agreed-upon demand number rather than separate forecasts by department — consistently outperform those that don't on inventory efficiency. Aligning the S&OP output with the manufacturing budget ensures production plans and financial plans are working from the same assumptions.
For demand that is genuinely unpredictable (new products, volatile customers, highly seasonal SKUs), the right response is often to shift toward make-to-order rather than attempting to forecast into finished goods. Make-to-order eliminates finished goods carrying risk at the cost of longer customer lead times — a trade-off that makes sense for high-value, low-volume items.
Connect Inventory to Financial Performance
Production operations and financial management tend to run in parallel without enough overlap. Inventory decisions have direct financial consequences: excess stock raises carrying costs, stockouts trigger expediting fees that inflate COGS, and obsolescence write-offs hit the bottom line directly.
The Manufacturing Cash Flow Template connects raw material purchasing timing to cash availability — which matters when large supplier invoices and payroll land in the same week. The Manufacturing Budget Template provides the framework for planning inventory-related costs (material purchases, carrying costs, anticipated obsolescence) as part of the broader operating plan.
Good inventory management is ultimately a financial discipline. The goal isn't to minimize stock for its own sake — it's to hold the amount of inventory that keeps production running at the lowest possible carrying cost. Getting there requires accurate records, calibrated reorder points, and a consistent review process that treats inventory data as a leading indicator rather than an accounting afterthought.
Last updated: March 25, 2026
Frequently Asked Questions
Related Articles
Auto Repair Pricing Guide: How to Price Your Shop Profitably
How auto repair shop owners should price labor and parts — covering labor rate calculation, flat-rate hours, parts markup matrices, diagnostic fees, and the metrics that matter.
Cleaning Service Pricing Guide: How to Price Your Business Profitably
A practical guide to cleaning service pricing — covering hourly vs. flat rate vs. per square foot models, price benchmarks by service type, labor cost math, and the common mistakes that keep cleaning businesses from hitting their margin targets.
Construction Pricing Guide: How to Price Your Work Profitably
How contractors should price construction work — covering labor burden, overhead recovery, material markup, pricing methods, and the mistakes that quietly erode margin.
Electrical Pricing Guide: How to Price Your Work Profitably
How electricians and electrical contractors should price their work — covering hourly rates, flat-rate pricing, overhead recovery, material markup, and common mistakes that erode margin.
Hotel Sales Forecast: A Practical Example and Guide
How to build a hotel sales forecast — covering rooms, F&B, events revenue, key metrics like RevPAR and ADR, booking pace, and the rolling forecast structure that keeps you ahead.
Landscaping Pricing Guide: How to Price Your Work Profitably
A practical guide to landscaping pricing — covering hourly rates, per-square-foot benchmarks, overhead recovery, and the markup math that determines whether you're making money.