Cleaning Service Pricing Guide: How to Price Your Business Profitably
A practical guide to cleaning service pricing — covering hourly vs. flat rate vs. per square foot models, price benchmarks by service type, labor cost math, and the common mistakes that keep cleaning businesses from hitting their margin targets.
Most cleaning businesses don't fail for lack of customers. They fail because their prices were never built to produce a profit.
The pattern is familiar: a solo operator or small crew starts taking jobs at rates that feel competitive, stays busy, then three years in wonders why there's nothing in the bank account. The problem usually isn't volume or quality. It's that the pricing was set by looking at competitors rather than by calculating what the work actually costs to do profitably.
This guide covers the mechanics: how each pricing model works, what customers actually pay across service types, what your true cost structure looks like, and where the most expensive mistakes happen.
The Four Pricing Models — and When to Use Each
There are four standard pricing approaches in cleaning. Each has the right application. Using the wrong model for the job type creates pricing that's either overpriced (losing bids) or underpriced (working at a loss).
Hourly rate is the most transparent model and works best for first-time visits, unpredictable jobs, or situations where scope genuinely can't be determined in advance. Standard hourly rates for residential cleaning run $35–$75 per hour per worker, with a national average often cited around $40–$50 per hour. The downside: hourly billing penalizes efficient crews (the faster you work, the less you earn) and makes total costs feel open-ended to customers.
Flat rate is the preferred model for recurring residential cleaning. Customers get price certainty; your business rewards crews who work efficiently. Flat rates are set based on the estimated duration of the job at your required cost-per-hour, not based on timing each visit. A 3-bedroom home might be priced at $175 per standard visit whether it takes the crew 2.0 hours or 2.5 hours.
Per square foot works well for commercial cleaning bids, one-time jobs, and move-in/move-out cleans where area is the dominant scope variable. Residential deep cleaning typically runs $0.10–$0.30 per square foot. Commercial cleaning bids are commonly priced at $0.07–$0.20 per square foot, with higher rates for specialty environments (medical offices, food service) and lower rates for large, simple spaces with good access.
Per room is an à la carte variant of flat-rate pricing — each room carries a price based on average cleaning time. It works for partial cleans or clients who want specific rooms addressed. Kitchen pricing typically runs $75–$100 per room; bathrooms $35–$60; bedrooms and living areas $25–$50. The main advantage is flexibility; the main disadvantage is it makes estimates more complex for both parties on full-house jobs.
Most growing cleaning companies use a hybrid: flat rate for recurring visits, per-square-foot or hourly for one-time and specialty jobs.
Price Benchmarks by Service Type
These are what customers actually pay — not your internal cost. Your cost structure sits underneath these numbers and determines whether you're making money at any given price.
Residential Cleaning
| Service | Typical Price Range | Notes |
|---|---|---|
| Standard cleaning visit (2 BR) | $100–$175 | Recurring rate |
| Standard cleaning visit (3 BR) | $130–$225 | Recurring rate |
| Standard cleaning visit (4+ BR) | $200–$350+ | Recurring rate |
| Hourly rate (per cleaner) | $35–$75 | For time-based billing |
| Per square foot (standard) | $0.10–$0.16/sq ft | Full-house clean |
| Deep cleaning | $200–$400 | National average ~$200 |
| Move-in / move-out cleaning | $120–$420 | Average ~$360 |
| Post-construction cleanup | $300–$700+ | Depends heavily on scope |
| Add-ons (inside oven, fridge) | $25–$60 each | Per item |
Commercial Cleaning
| Service | Typical Price Range | Notes |
|---|---|---|
| Per square foot (standard office) | $0.07–$0.15/sq ft | Nightly or weekly service |
| Per square foot (medical/food service) | $0.12–$0.25/sq ft | Specialty protocols required |
| Hourly rate (commercial) | $30–$75/hr | Per worker |
| Per visit average (all sizes) | $70–$1,500 | Size- and frequency-dependent |
| National average per visit | ~$390 | Per Angi/HomeAdvisor data |
| Window cleaning (above ground) | Higher rate applies | Separate workers' comp class |
Why One-Time Jobs Should Cost More
A common pricing mistake is treating deep cleans, move-ins, and first-time visits the same as recurring visits. These jobs cost more to deliver — they take longer per square foot, use more supplies, often require more drive time, and don't benefit from the route efficiency that makes recurring residential clients so economical to serve. Price them at a premium or they become your worst-margin work.
Building Your Rate From Costs
The most common pricing failure in cleaning is setting rates based on what competitors charge without knowing whether those rates actually cover costs. The right approach starts with your cost structure.
Step 1: Know Your Loaded Labor Rate
A cleaner earning $15/hour doesn't cost $15/hour to employ. Once you add payroll taxes and workers' compensation insurance, the true cost rises substantially:
- FICA and Medicare (employer portion): 7.65% of wages
- State unemployment insurance: ~1.5% of wages
- Federal unemployment insurance: ~0.8% of wages
- Workers' compensation (janitorial class): approximately $2.43–$3.31 per $100 of payroll (varies by state and classification — residential cleaning typically runs higher than commercial janitorial)
In total, employee overhead typically adds 15–25% on top of the base wage. A $15/hour cleaner costs roughly $17.50–$19/hour in loaded labor cost before you've spent a dollar on supplies, equipment, or running the business.
A practical formula: multiply the base hourly wage by 1.2–1.25 to get a conservative loaded labor rate. Use the higher end if your workers' comp class rate is high or your state has higher unemployment taxes.
Step 2: Calculate Your Overhead Rate
Overhead is every cost that doesn't go directly to a specific job: liability insurance, vehicle expenses, equipment maintenance, scheduling software, marketing, administrative time, office costs, and your own owner salary if you're working in the business.
The calculation:
- Add up all annual non-job costs (everything except direct labor and supplies used on jobs)
- Divide by realistic annual billable hours (actual hours billed, not total employee clock hours — account for travel time, unpaid breaks, and days without billable work)
- The result is your overhead cost per billable hour
A cleaning business running two crews might carry $80,000–$150,000 in annual overhead. At 3,000 annual billable hours, that's $27–$50 per billable hour in overhead that has to be recovered through pricing.
If that number isn't reflected in your job pricing, every hour worked is subsidizing overhead rather than recovering it. The cleaning service break-even calculator lets you test how changes in billable hours and overhead affect your break-even point.
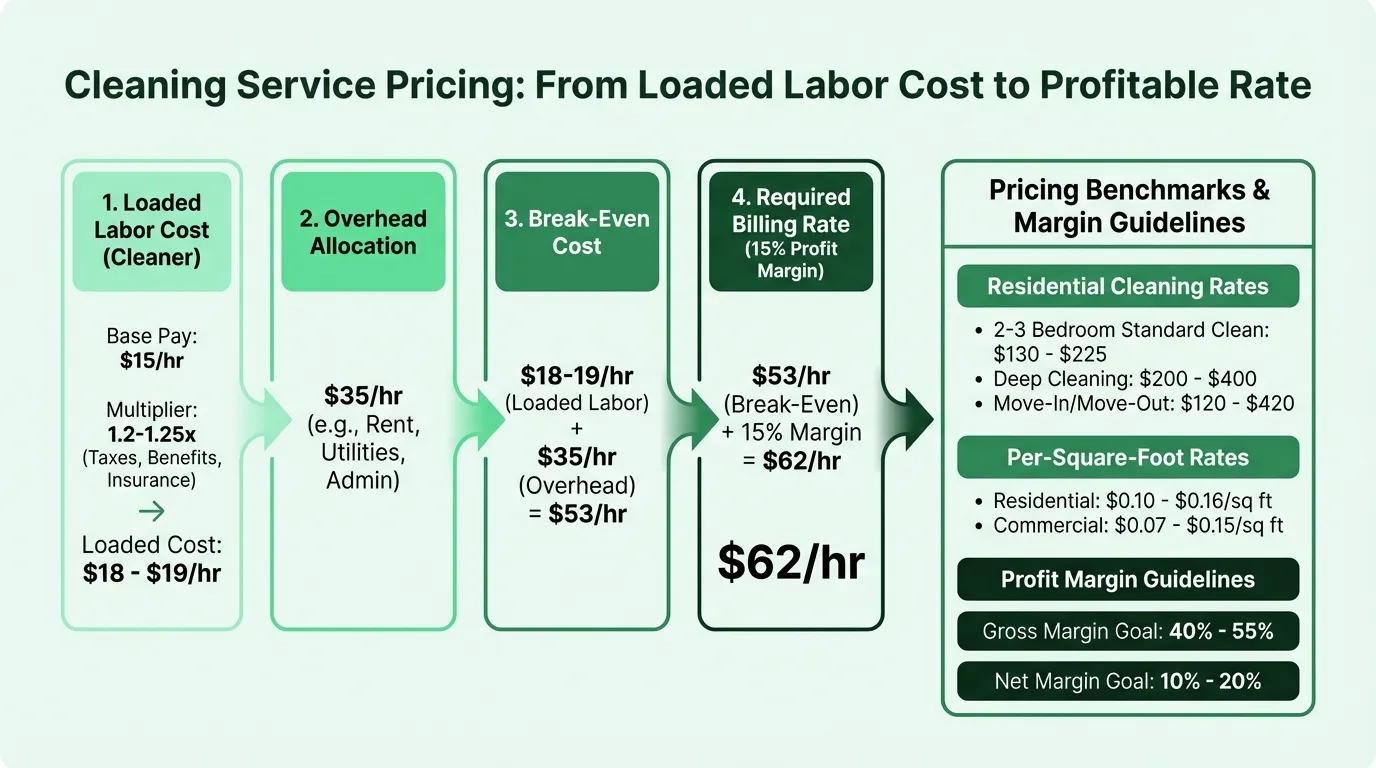
Step 3: Build the Full Rate
| Component | Example |
|---|---|
| Loaded wage (per cleaner per hour) | $18/hr |
| Overhead allocation per hour | $35/hr |
| Break-even cost | $53/hr |
| Target profit (15%) | $9/hr |
| Required billing rate | $62/hr |
A residential cleaning business billing $40/hour at this cost structure isn't lean — it's losing money on every job, regardless of how full the schedule looks.
Most industry guidance suggests keeping overhead below 35% of monthly revenue. If overhead is running above that threshold, investigate whether it's a fixed cost problem (too much overhead for current revenue) or a variable cost problem (jobs not priced to recover their overhead share).
Step 4: Price the Job, Not Just the Hour
Once you know your required hourly rate, price jobs based on expected duration rather than tracking time on every visit.
For a 3-bedroom recurring clean that takes a 2-person crew 2 hours:
- Total crew hours: 4
- Loaded labor: 4 × $18 = $72
- Overhead allocation: 4 × $35 = $140
- Total cost: $212
- At 15% target margin: $212 ÷ 0.85 = $249 flat rate
If the market in your area supports $175 for a 3-bedroom clean, that's a signal to re-examine your cost structure — either you need to reduce overhead, improve crew efficiency, or operate in a segment where rates support profitability.
Markup vs. Margin — A Critical Distinction
This is one of the most expensive math errors in service businesses: confusing markup (calculated on cost) with gross margin (calculated on revenue).
A 25% markup on a $100 cost produces a $125 selling price — but that's a 20% gross margin, not 25%. If your target is a 25% gross margin, you need a 33% markup.
The formula to price for a specific gross margin target:
Selling Price = Cost ÷ (1 − Target Margin)
| Target Gross Margin | Required Markup on Cost |
|---|---|
| 20% | 25% |
| 25% | 33% |
| 30% | 43% |
| 40% | 67% |
| 50% | 100% |
Apply this when pricing supplies and materials too. Cleaning supplies used on a job aren't a pass-through at cost — you're absorbing purchase logistics, storage, waste, and the administrative time of maintaining supply inventory. Standard practice is to build supply costs into the job rate rather than itemizing them, but the costs need to be in the math. The cleaning service markup calculator handles the conversion between markup and margin targets for you.

Need a ready-made budget template for your cleaning service?
Download a pre-built spreadsheet with industry-specific categories, formulas, and formatting.
Pricing by Service Mix
Not all service types carry the same economics. Knowing your margin by service line helps you decide where to focus growth and whether your current sales mix is working in your favor.
Recurring residential contracts are the most economically efficient work in cleaning. Teams know the properties, routes are optimized, and supply usage is predictable. Gross margins on this work typically run 45–55% when priced correctly. This is where route density matters — adding a client two blocks away from existing clients is fundamentally different from adding one across town.
Commercial cleaning contracts often involve larger crews and more supplies per square foot, but volume and schedule predictability offset that. Well-run commercial contracts typically produce gross margins of 40–50%, with net margins after overhead of 10–15%. Large commercial contracts can also come with payment terms that create cash flow pressure — factor that into the bid if payment is net 30 or longer.
One-time deep cleans command premium pricing but carry higher per-job costs because of supply intensity, travel time, and the preparation required. Target gross margins of 35–50%, but only if you're actually pricing at a premium. If you're selling deep cleans at your standard recurring rate, you're losing margin on every one.
Move-in/move-out cleaning is similar to deep cleaning in cost structure — labor-intensive, supply-heavy, unpredictable scope. The average job runs $120–$420 nationally. If a job requires significant stain treatment, carpet work, or condition worse than expected, scope and price accordingly before starting, not after.
Post-construction cleanup is the highest-cost service type and should be priced accordingly — $300–$700+ for residential, more for commercial. Debris removal, specialized equipment, and multiple passes are common. Price as a separate category with a different rate structure from standard cleaning.
Industry Profitability Benchmarks
These are realistic benchmarks for well-run cleaning businesses, not aspirational projections:
| Metric | Benchmark Range |
|---|---|
| Gross margin (overall) | 40–55% |
| Net margin (overall) | 10–20% |
| Labor cost as % of revenue | 35–50% |
| Overhead as % of revenue | Target below 35% |
| Net margin (residential focus) | 15–20% |
| Net margin (commercial focus) | 10–15% |
The reported industry average net margin across all cleaning businesses is approximately 6.3%, which is pulled down heavily by solo operators and small businesses that are underpriced and undertracked. The 10–20% net margin range is achievable — but only for businesses that know their cost structure and price accordingly.
Most cleaning businesses can show 40–55% gross margin on paper. The gap to net margin — often landing at 10–20% for healthy operations — represents overhead. If your gross margin looks fine but net income is thin, the overhead section of your income statement will tell you where the margin went. Liability insurance, vehicle costs, and scheduling software are the most common culprits.
Common Pricing Mistakes
Not knowing your overhead rate. If you haven't calculated your annual overhead and divided it by your actual billable hours, you can't know whether your prices are covering all costs. This is the single most common financial gap in small cleaning businesses. Running the calculation for the first time almost always reveals a gap.
Pricing by competitors. A competitor's rate tells you what they charge, not whether they're profitable at it. A large portion of cleaning businesses operate at 6% or below net margin — benchmarking against them replicates their problems.
Treating all jobs as the same. Recurring weekly visits, first-time deep cleans, and move-out jobs have different cost structures. A rate that produces a 20% net margin on efficient recurring residential visits may produce a 3% net margin or a loss on a move-out clean if the pricing isn't adjusted for the difference.
Not raising prices as costs rise. Wages, fuel, insurance, and supplies have all increased materially in recent years. Many cleaning businesses raise prices irregularly — or not at all — while costs increase steadily. Pricing that was correct three years ago often isn't correct today. Review pricing at minimum annually against current cost inputs.
Underpricing to win new clients. The instinct to come in low on a first job to establish a relationship is understandable. The math rarely supports it. Clients acquired at below-market rates are typically the hardest to raise prices on later and generate the worst margins throughout the relationship.
Ignoring scope creep on one-time jobs. Inside appliances, windows, cabinets, and specialty areas should be priced explicitly — not included as a courtesy when the crew is already there. Define what's included in every quote. Work outside that scope is a change order with additional pricing, not a gift.
Not tracking labor cost percentage monthly. If your labor cost as a percentage of revenue climbs from 40% to 47%, you have a scheduling or staffing problem — too many hours on low-value jobs, too much travel time, or too many employees for current volume. Catching that in month three is fixable. Catching it at year-end means a full year of margin has been given away. The Cleaning Service Budget Template structures monthly tracking by service type so cost drift shows up before it compounds.
The Numbers to Track
Pricing improves when you measure results on completed work. Track these monthly:
Gross margin by service type. Revenue minus direct labor and supplies, by service category. Target 40–55% overall. If recurring residential is running 30%, either pricing is off or labor cost is too high for that route. If one-time jobs are running 25%, you're likely not pricing for the actual cost of that work.
Labor cost as a percentage of revenue. Direct labor including payroll taxes, divided by revenue. Target 35–50%. Any consistent reading above 50% is a signal requiring investigation — scheduling efficiency, staffing level, or pricing.
Revenue per billable field hour. Total revenue divided by total field hours. This tells you whether your pricing and service mix are generating adequate throughput per labor unit. A low number here almost always leads back to either underpriced jobs or too much time on travel and non-billable activity. Check your per-job margins quickly with the cleaning service profit margin calculator.
Net margin. The bottom line after all overhead. Target 10–20%. A business running 5–6% net isn't a business in crisis — it's a business with a pricing or overhead problem that's solvable if you know where to look.
The Cleaning Service Income Statement Template gives you a model built around how cleaning businesses actually work — with revenue broken into recurring residential, commercial contracts, one-time deep cleans, move-in/move-out, and post-construction, and cost structure that tracks labor and supply costs separately by service line. The Service Line Summary sheet makes it straightforward to watch margin by service type month-by-month rather than discovering a problem at year-end.
The Foundation
The cleaning businesses that consistently hit 15–20% net margins share one thing: they can explain what's in their price. They know their loaded labor rate, their overhead per billable hour, and their margin target. When they quote a job, the number traces back to real costs — not a rate that felt competitive or one borrowed from a competitor who may not be profitable either.
Start with the overhead calculation if you haven't run it. Add up annual non-job costs, divide by actual billable hours, and check whether that number is in your current pricing. Most cleaning business owners who run this for the first time find a gap. Finding it is the first step toward fixing it.
Last updated: March 25, 2026
Frequently Asked Questions
Related Articles
Auto Repair Pricing Guide: How to Price Your Shop Profitably
How auto repair shop owners should price labor and parts — covering labor rate calculation, flat-rate hours, parts markup matrices, diagnostic fees, and the metrics that matter.
Construction Pricing Guide: How to Price Your Work Profitably
How contractors should price construction work — covering labor burden, overhead recovery, material markup, pricing methods, and the mistakes that quietly erode margin.
Electrical Pricing Guide: How to Price Your Work Profitably
How electricians and electrical contractors should price their work — covering hourly rates, flat-rate pricing, overhead recovery, material markup, and common mistakes that erode margin.
Hotel Sales Forecast: A Practical Example and Guide
How to build a hotel sales forecast — covering rooms, F&B, events revenue, key metrics like RevPAR and ADR, booking pace, and the rolling forecast structure that keeps you ahead.
Landscaping Pricing Guide: How to Price Your Work Profitably
A practical guide to landscaping pricing — covering hourly rates, per-square-foot benchmarks, overhead recovery, and the markup math that determines whether you're making money.
Manufacturing Inventory Management: Best Practices
Practical manufacturing inventory management best practices — covering ABC analysis, MRP, WIP control, safety stock, and the metrics that matter most on the shop floor.