Hotel Sales Forecast: A Practical Example and Guide
How to build a hotel sales forecast — covering rooms, F&B, events revenue, key metrics like RevPAR and ADR, booking pace, and the rolling forecast structure that keeps you ahead.
A hotel's financial decisions — staffing levels, rate strategy, purchasing, capital expenditure — all flow from one upstream number: projected revenue. Without a structured sales forecast, you're making those decisions in the dark.
Hotel forecasting is more complex than most industries because you're managing multiple revenue streams simultaneously. Rooms are the obvious one, but food and beverage, events, and ancillary services each have different demand drivers, different booking lead times, and different cost structures. A forecast that only looks at occupancy misses most of the picture.
What a Hotel Sales Forecast Actually Covers
A complete hotel sales forecast is a total revenue projection, not just a rooms forecast. Most hotels have three to five distinct revenue centers:
Rooms revenue is typically 60–70% of total hotel revenue. The forecast projects occupancy rate, ADR (Average Daily Rate), and the resulting RevPAR for each future period. This is the core of the model.
Food and beverage is the second-largest revenue stream for most full-service properties. F&B includes restaurant dining, banquet and catering revenue, bar and beverage, and room service. In 2025, CBRE reported a 3.8% year-over-year increase in F&B revenue per occupied room, making it one of the stronger growth segments in hotel revenue.
Events and meetings — meeting room rental, conference packages, and group event revenue — are forecasted separately because they have much longer booking lead times and are managed through a sales pipeline. CBRE reported public room rental growing at 9.5% year-over-year in 2025.
Other revenue covers spa and wellness, parking, retail, and ancillary charges. These vary widely by property type but are worth tracking as distinct lines if they're material.
A well-built hotel sales forecast rolls these streams into a total revenue summary, calculates TRevPAR (Total Revenue Per Available Room), and tracks how each line performs relative to budget and prior year.
The Core Metrics
Before building the forecast, understand the three metrics that drive everything:
RevPAR (Revenue Per Available Room)
RevPAR = ADR × Occupancy Rate
RevPAR is the most widely used single metric for hotel performance because it accounts for both rate and volume. A hotel charging $180 ADR at 60% occupancy ($108 RevPAR) is performing differently from one at $120 ADR and 85% occupancy ($102 RevPAR), even if the RevPAR is similar — the cost structures and rate strategies are completely different.
U.S. hotel RevPAR averaged $102.78 in 2025, with national occupancy at 63.4% (TakeUp AI, 2025 benchmarks). Regional and segment variation is significant — New York City properties run at around 84% occupancy, while midscale properties in the Midwest may see closer to 59%. Run your property's RevPAR through the hotel profit margin calculator to see how your rate and occupancy translate to operating margin.
ADR (Average Daily Rate)
ADR = Total Room Revenue ÷ Rooms Sold
ADR measures pricing effectiveness. It's what you actually charge per sold room, net of discounts and channel costs. PwC forecast ADR growth of 1.3% for 2025 — meaningful when you're managing hundreds of rooms.
TRevPAR (Total Revenue Per Available Room)
TRevPAR = Total Revenue from All Departments ÷ Total Available Rooms
TRevPAR is a better measure of overall financial performance than RevPAR alone. It captures whether F&B and events revenue are compensating for or compounding room revenue trends. A hotel with soft occupancy but a strong banquet calendar looks very different under TRevPAR than RevPAR.
Segmenting Demand: Why One Number Isn't Enough
Hotels serve fundamentally different guest types with different booking patterns, price sensitivities, and revenue contributions. Aggregating them into a single occupancy forecast hides the detail that drives strategy.
The standard market segments:
| Segment | Booking Lead Time | Rate Sensitivity | F&B Attachment |
|---|---|---|---|
| Corporate / Business | Short (1–14 days) | Low-medium | Low |
| Leisure | Medium (14–90 days) | High | Medium |
| Group / MICE | Long (90–365 days) | Negotiated | High |
| OTA / Wholesale | Variable | High | Low |
| Direct / Loyalty | Variable | Low | Medium |
A forecast built by segment lets you see if a projection shortfall is coming from corporate (an economic signal), leisure (a pricing or marketing signal), or group (a pipeline issue). Without segmentation, the model will tell you revenue is down but not why — and you won't know which lever to pull. This segment-level detail also feeds directly into your hotel budget, where revenue assumptions drive every cost line.
The Hotel Sales Forecast Template includes a segment breakdown alongside the total rooms revenue view, so you can track each channel independently.
Booking Pace: The Real-Time Demand Signal
For the 30–90 day horizon, historical averages are less useful than booking pace — how quickly reservations are accumulating relative to prior years for the same future dates.
If you're looking at arrivals 45 days out and you have 30% more bookings on the books than at the same point last year, demand is tracking ahead. You can raise rates, tighten discount availability, or close out lower-tier channels early.
If you're pacing 20% behind last year, you need to investigate: Is the market soft? Are your rates uncompetitive? Is there a new competing property in your comp set? Early pace data gives you 6–8 weeks to respond — enough lead time for targeted promotions, group outreach, or distribution adjustments.
The pace analysis framework:
| Horizon | Update Frequency | Primary Use |
|---|---|---|
| D-30 (30 days out) | Daily | Rate strategy, discount management |
| D-60 | 2–3x per week | Marketing decisions, group follow-up |
| D-90 | Weekly | Budget confidence, staffing planning |
| D-180+ | Monthly | Full-year budget revisions |

Need a ready-made sales forecast template for your hotel?
Download a pre-built spreadsheet with industry-specific categories, formulas, and formatting.
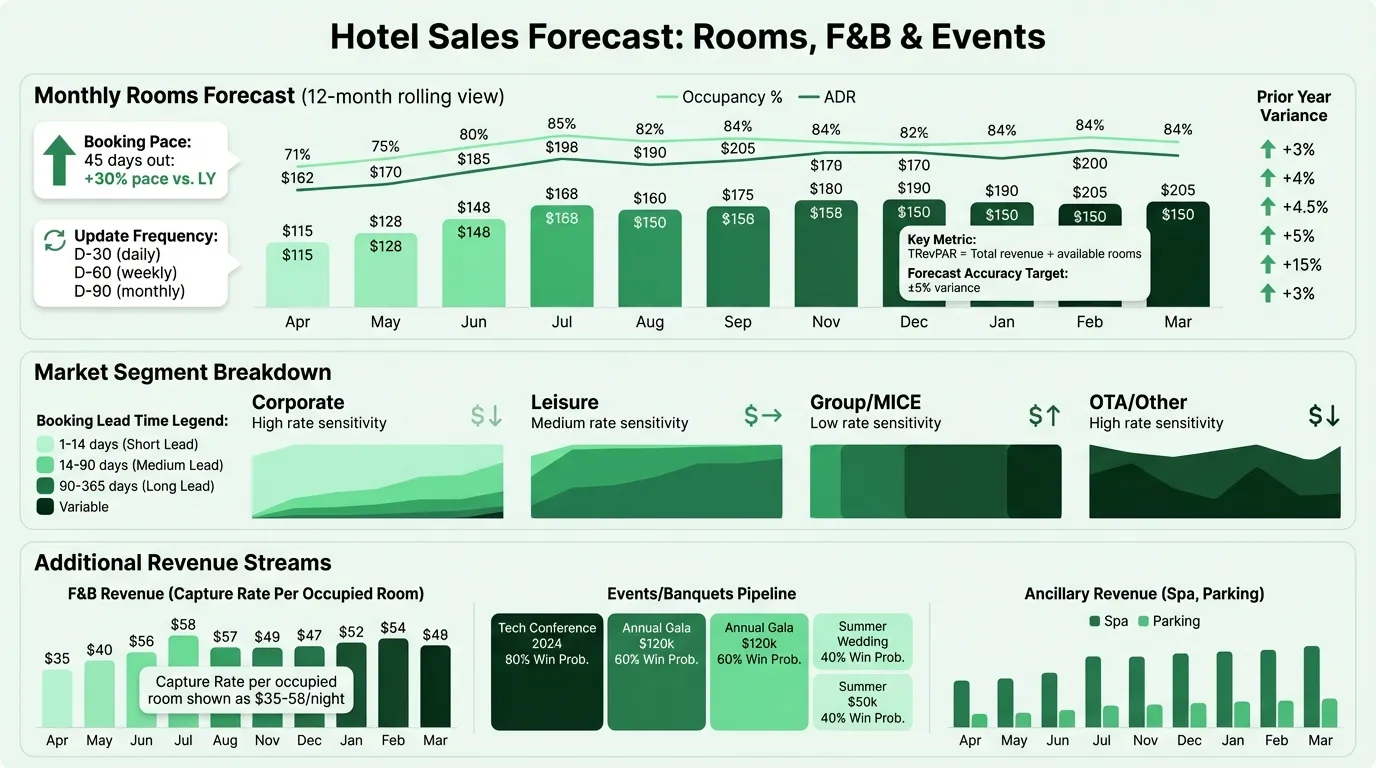
A Practical Example: Monthly Rooms Forecast
Here's what a simplified monthly rooms forecast looks like for a 150-room full-service hotel:
| Month | Available Rooms | Occ. % | ADR | RevPAR | Rooms Rev. | Prior Year RevPAR | Variance |
|---|---|---|---|---|---|---|---|
| April | 4,500 | 71% | $162 | $115 | $517,500 | $109 | +5.5% |
| May | 4,650 | 76% | $174 | $132 | $614,250 | $127 | +3.9% |
| June | 4,500 | 82% | $189 | $155 | $697,500 | $148 | +4.7% |
| July | 4,650 | 85% | $198 | $168 | $781,200 | $161 | +4.3% |
The forecast builds forward from this rooms view, then layers F&B and events revenue on top. A hotel with consistent 70–75% restaurant capture rates on occupied rooms, plus a banquet calendar already partially booked, can project F&B revenue with reasonable confidence 60–90 days out.
Group and events revenue works differently. The forecast here is pipeline-based: active leads are evaluated by sales stage and assigned win probabilities. A $40,000 banquet contract at 80% probability contributes $32,000 to the forecast — not zero, not $40,000. This weighted pipeline view prevents both overconfidence and underestimation in the events line. Hotels with incentive-based sales teams can use the same pipeline data to calculate commission payouts — Carvd automates that process.
The Rolling Forecast Structure
A single annual forecast, set in January and not revisited, is a budget — not a forecast. The difference matters. Forecasts are living documents.
Best practice for hotel forecasting uses three parallel horizons:
30-day rolling forecast (updated daily) The operational view. Drives staffing levels, F&B purchasing, housekeeping schedules, and same-day rate decisions. You need this current.
90-day rolling forecast (updated weekly) The revenue management view. Drives rate strategy, segment focus, promotional activity, and group sales targeting. A 90-day horizon gives you enough lead time to make meaningful pricing or distribution changes.
12-month forecast (updated monthly) The financial planning view. Used for lender reporting, budget reforecast, capital planning, and owner updates. Each month, you reconcile actual performance against forecast and revise the forward 11 months.
Scenario planning sits on top of all three: a base case, a downside case (if demand softens by 10–15%), and an upside case (if a key piece of group business confirms). Decision-makers need to know what the business looks like under each scenario, not just the midpoint.
How the Forecast Connects to Everything Else
The sales forecast isn't a standalone document. It drives:
Staffing decisions. Projected occupancy and F&B covers determine how many housekeeping, front desk, and F&B staff you need per day. Understaffing costs you in service quality; overstaffing erodes margin. Both start from forecast accuracy.
Purchasing and food costs. Restaurant and banquet revenue projections drive weekly purchasing quantities. The forecast tells your F&B director whether to expect a $12,000 week or a $32,000 week — a decision that affects what and how much to order.
Income statement and budget. The sales forecast is the top line of your Hotel Income Statement. Every cost line — labor, food cost, utilities, maintenance — is calibrated as a percentage of projected revenue. A meaningful budget requires a realistic revenue forecast underneath it.
Cash flow planning. Revenue timing varies by channel: direct bookings may require deposits 90 days out; OTA revenue settles 30 days after checkout; group deposits arrive months in advance. The forecast feeds directly into your hotel cash flow planning to show when money actually arrives versus when costs are due.
Rate strategy. Revenue managers set pricing by segment and channel based on where the forecast is tracking against pace. If the 60-day forecast is running ahead of last year for weekend leisure demand, that's the signal to increase weekend rates and tighten discounts.
Building the Forecast in Practice
For a hotel building or rebuilding its forecast:
Start with 24 months of history. Pull room revenue by month, broken down by segment and channel. Calculate historical occupancy, ADR, and RevPAR. These are your baseline and your seasonal multipliers.
Build the rooms model first. Project occupancy and ADR by month and segment. Apply year-over-year trend adjustments and seasonal factors. This is your largest revenue line and the one with the most data to support it.
Layer in F&B using capture rates. F&B revenue per occupied room is the practical way to forecast food and beverage for most properties. If your restaurant historically generates $35 per occupied room on weekdays and $58 on weekends, apply those rates to your rooms forecast.
Use your pipeline for events. Pull your current group leads, apply win probabilities by stage, and build the events forecast from confirmed plus weighted bookings.
Track variance religiously. Each month, compare actuals to forecast. If occupancy consistently comes in 5 points ahead of forecast, your assumptions are off. Adjust, don't just shrug and move on. A forecast that's never updated to reflect reality stops being useful quickly. Monitor how forecast variances translate to cash timing gaps with the Hotel Cash Flow Template.
The Hotel Sales Forecast Template includes the rooms model, F&B capture rate structure, rolling 12-month view, and variance tracking — built for the revenue and finance function, not just the front office.
Last updated: March 25, 2026
Frequently Asked Questions
Related Articles
Auto Repair Pricing Guide: How to Price Your Shop Profitably
How auto repair shop owners should price labor and parts — covering labor rate calculation, flat-rate hours, parts markup matrices, diagnostic fees, and the metrics that matter.
Cleaning Service Pricing Guide: How to Price Your Business Profitably
A practical guide to cleaning service pricing — covering hourly vs. flat rate vs. per square foot models, price benchmarks by service type, labor cost math, and the common mistakes that keep cleaning businesses from hitting their margin targets.
Construction Pricing Guide: How to Price Your Work Profitably
How contractors should price construction work — covering labor burden, overhead recovery, material markup, pricing methods, and the mistakes that quietly erode margin.
Electrical Pricing Guide: How to Price Your Work Profitably
How electricians and electrical contractors should price their work — covering hourly rates, flat-rate pricing, overhead recovery, material markup, and common mistakes that erode margin.
Landscaping Pricing Guide: How to Price Your Work Profitably
A practical guide to landscaping pricing — covering hourly rates, per-square-foot benchmarks, overhead recovery, and the markup math that determines whether you're making money.
Manufacturing Inventory Management: Best Practices
Practical manufacturing inventory management best practices — covering ABC analysis, MRP, WIP control, safety stock, and the metrics that matter most on the shop floor.