Auto Repair Pricing Guide: How to Price Your Shop Profitably
How auto repair shop owners should price labor and parts — covering labor rate calculation, flat-rate hours, parts markup matrices, diagnostic fees, and the metrics that matter.
Most auto repair shops aren't failing because they lack customers. They're failing because their prices don't cover their actual costs.
The math is surprisingly common: a busy shop with full bays, loyal customers, and a skilled team still posts a net margin of 4–6%. The problem isn't volume — it's that the posted labor rate was set by looking at competitors rather than by calculating what the shop actually costs to run. Parts are marked up with a flat percentage that made sense a decade ago and hasn't been reviewed since. Diagnostics get done for free as a "customer service" gesture that costs real money.
Getting pricing right in auto repair starts with understanding the underlying mechanics.
Setting Your Labor Rate (The Math Behind the Number)
The national average mechanic labor rate is approximately $143/hour. But that number tells you nothing about whether $143/hour is the right rate for your shop. The right rate depends on your specific costs.
Here's the calculation:
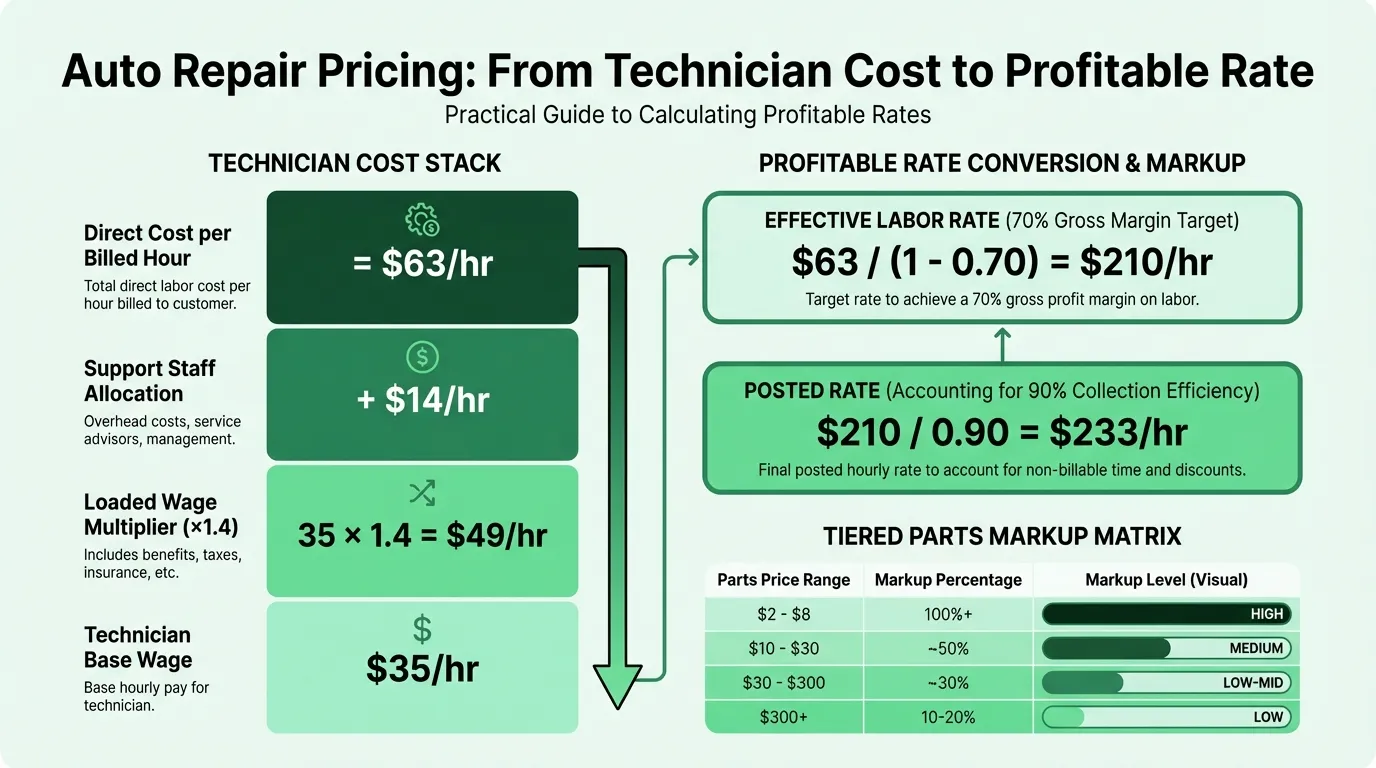
Step 1: Calculate loaded technician cost. A technician earning $35/hour doesn't cost $35/hour. Add employer payroll taxes, workers' compensation insurance, health benefits, and paid time off, and the true employment cost rises to roughly 1.4× the base wage. At $35/hour, that's approximately $49/hour in loaded cost.
Step 2: Allocate support staff. Service advisors, parts managers, and administrative staff are overhead that has to be recovered through labor billing. Divide each support role's loaded cost across the technicians they support. If one service advisor (loaded at $42/hour) supports three technicians, add $14/hour to each tech's cost. Now you're at $63/hour in direct cost per billed tech hour.
Step 3: Apply a gross profit target. Divide that direct cost by (1 − your target gross margin). Most advisors recommend targeting 65–70% gross margin on labor — the industry benchmark for a healthy shop. At 70% gross margin:
$63 ÷ (1 − 0.70) = $210/hour effective labor rate
This is before rent, utilities, software, equipment, and any other fixed overhead. Add those costs and your actual posted rate needs to be higher.
Step 4: Adjust for collection efficiency. Not every billed hour gets fully collected — comebacks, warranty repairs, and discounts reduce what's actually in the bank. Most shops collect around 90% of billed labor. Divide by 0.90 to get the posted rate that produces your target after discounting.
The quick rule of thumb: your posted labor rate should be roughly 3× the technician's loaded hourly cost. If you're charging $120/hour and your loaded tech cost is $50/hour, you're leaving significant margin on the table.
| Cost Component | Example |
|---|---|
| Technician base wage | $35/hour |
| Loaded wage (×1.4 multiplier) | $49/hour |
| Support staff allocation | $14/hour |
| Direct cost per billed hour | $63/hour |
| Target ELR (at 70% gross margin) | $210/hour |
| Posted rate (at 90% collection) | $233/hour |
This is a simplified model. The point isn't to hit a specific dollar amount — it's to know that your rate is covering your actual costs plus a real profit margin, not just a guess. You can test different wage and margin assumptions with the auto repair break-even calculator.
How Flat-Rate Hours Work
Most auto repair pricing uses flat-rate (or "flag") hours — standardized labor times published by industry guides for each specific repair. The shop multiplies the guide time by its posted rate to calculate the customer charge, regardless of how long the job actually takes.
A brake caliper replacement that flat-rates at 1.4 hours at a $150/hour rate costs the customer $210 in labor, whether the tech completes it in 1.1 hours or 1.7 hours.
Three major guides publish flat-rate times:
- Mitchell 1 (ProDemand): Aftermarket times widely used by independent shops. Frequently updated. Tends to allow slightly more time than OEM guides to account for real-world shop conditions.
- MOTOR (formerly Chilton): Based on field testing and technician surveys, factoring in component access, tool requirements, and vehicle condition. Also common at independent shops.
- ALLDATA: Sources times directly from OEM factory service manuals. Times reflect manufacturer assumptions — factory-trained technicians with the right equipment. Generally tighter than aftermarket guides.
Each guide can produce a different time for the same repair. ALLDATA times tend to be lower; Mitchell and MOTOR times tend to be slightly more generous. The guide you choose directly affects what you charge. This isn't a trivial distinction — a 0.3-hour difference on a job that runs daily adds up across a full service bay.
Most guides also include overlap times: when two repairs share disassembly (replacing a water pump and timing belt together, for example), the combined time is less than the sum of each individually. You can pass some of that efficiency to the customer or retain it as additional margin — but you need to know the overlap is there to make that decision.
Parts Markup: Why a Flat Percentage Doesn't Work
A common mistake is applying the same markup percentage to every part. The problem: handling, sourcing, and warranty risk on a $6 sensor clip are the same as on a $400 alternator, but a 30% markup on $6 earns you $1.80. A tiered markup matrix fixes this.
| Part Cost | Typical Markup | Target Gross Margin |
|---|---|---|
| $2–$8 | 100%+ | 50%+ |
| $10–$30 | ~50% | ~33% |
| $30–$300 | ~30% | ~23% |
| $300+ | 10–20% | ~15–17% |
The goal on parts overall is 40–50% gross margin for a well-run independent shop. A PartsTech survey of 618 shop owners found that 67% of shops are under-pricing parts — potentially leaving $40,000–$70,000 in annual revenue on the table.
Markup and margin are not the same thing. This is worth repeating because shops routinely confuse them:
- A 50% markup on a $100 part yields a $150 selling price — but a 33% gross margin
- To hit 50% gross margin, you need a 100% markup on cost
The formula to price a part for a specific gross margin target:
Selling Price = Part Cost ÷ (1 − Target Margin)
For a 45% margin on a $80 part: $80 ÷ 0.55 = $145.45
Using markup when you mean margin consistently leaves money on the table. On a shop doing $400,000 in annual parts revenue, the difference between 33% and 45% gross margin is approximately $48,000 in gross profit. The auto repair markup calculator converts between markup and margin so you can verify your parts pricing targets the right number.
Diagnostic Fees
As vehicles have become more complex — ADAS systems, hybrid powertrains, CAN bus networks — diagnostic time has increased significantly. A qualified technician scanning codes, running actuator tests, reviewing TSBs, and isolating a root cause may spend 45–90 minutes before any repair starts.
The industry standard is to charge one flat-rate labor hour for diagnostics — typically $75–$200 depending on your posted rate. Most shops apply the diagnostic fee toward the repair if the customer approves the work. This structure:
- Ensures diagnostic time is never free
- Reduces customer friction (the fee disappears if they proceed)
- Charges the customer the full fee if they decline the repair (which is fair — the work was done)
Shops that scan vehicles for free are subsidizing OEM engineering complexity with their own labor. That's a sustainable approach when vehicles were simpler. It's not sustainable now.
One corollary: never quote a repair without diagnosing first. A customer who describes symptoms doesn't know what part needs replacement. A shop that guesses and quotes wrong either eats a comeback or loses a customer. The diagnostic fee funds the process of finding the right answer.
Need a ready-made budget template for your auto repair?
Download a pre-built spreadsheet with industry-specific categories, formulas, and formatting.
Flat-Rate vs. Time-and-Materials for Customers
Most shops use flat-rate billing for standard repairs (estimated guide time × posted rate) and time-and-materials billing for custom work, unusual situations, or repairs without clear guide times. The right choice depends on the job:
Use flat-rate billing when:
- The repair has a published guide time
- Scope is well-defined before work starts
- A skilled tech can realistically meet or beat the guide time
Use time-and-materials when:
- The job is diagnostic-heavy or scope is genuinely unknown
- The vehicle is in poor condition (rust, seized components) that makes guide times unreliable
- Custom fabrication or modifications are involved
The hidden risk with flat-rate billing on difficult vehicles: seized bolts, stripped fasteners, and corroded components can turn a 2.0-hour job into a 4.0-hour job. Your policy for handling this matters. A change-order or authorization process — where the advisor calls the customer when additional time is required — protects both margin and the customer relationship.
Common Pricing Mistakes
Setting rates based on competitors, not costs. The shop down the street may charge $110/hour because they've charged $110/hour for eight years and haven't done the math. If your cost structure requires $140/hour to hit a 10% net margin, charging $110/hour because the competition does is a reliable path to unprofitability.
Not knowing your effective labor rate (ELR). ELR is actual dollars collected per billed labor hour — after discounts, comebacks, and warranty work. Most shop management software tracks this. If your posted rate is $150/hour and your ELR is $118/hour, there's a 21% gap between what you're charging and what you're collecting. That gap usually lives in discounts, free services, or warranty repairs that aren't being tracked.
Filling the schedule with low-margin work. Oil changes and tire rotations keep technicians busy but generate low revenue per hour. An appointment slot used for a $45 oil change displaces a potential $300 brake job. Pricing should reflect where you want to spend your limited bay time — and service advisors should be guided accordingly. The auto repair profit margin calculator helps quantify the margin difference between service types.
No change order discipline. Additional work discovered mid-repair must have a written authorization before it's performed. "While you're in there" is revenue if documented. Without a change order, it's a donation and a potential dispute.
Under-pricing on small jobs to stay competitive. The margin on a $200 repair may be proportionally worse than the margin on a $1,500 repair if the small job has the same diagnostic time, the same parts ordering process, and the same customer interaction. Price small jobs to cover their true overhead.
The Numbers to Track
Pricing decisions improve through feedback. Track these metrics on completed jobs:
Effective labor rate (ELR): What you actually collected per billed labor hour. Compare monthly. A downward trend in ELR usually means discounts are increasing, or warranty/comeback work is rising.
Parts gross margin: (Parts revenue − parts cost) ÷ parts revenue. Target: 40–50%. If you're running 25%, the tiered markup matrix needs attention.
Gross profit per repair order: The total gross margin dollar amount per closed ticket. This tells you whether your average repair order is moving in the right direction — more revenue and better margin per ticket, or more tickets at worse margin.
Labor hours per car: Billed labor hours divided by vehicles serviced. If this number is low, you may be under-diagnosing, recommending fewer services, or losing recommended work to deferred decisions.
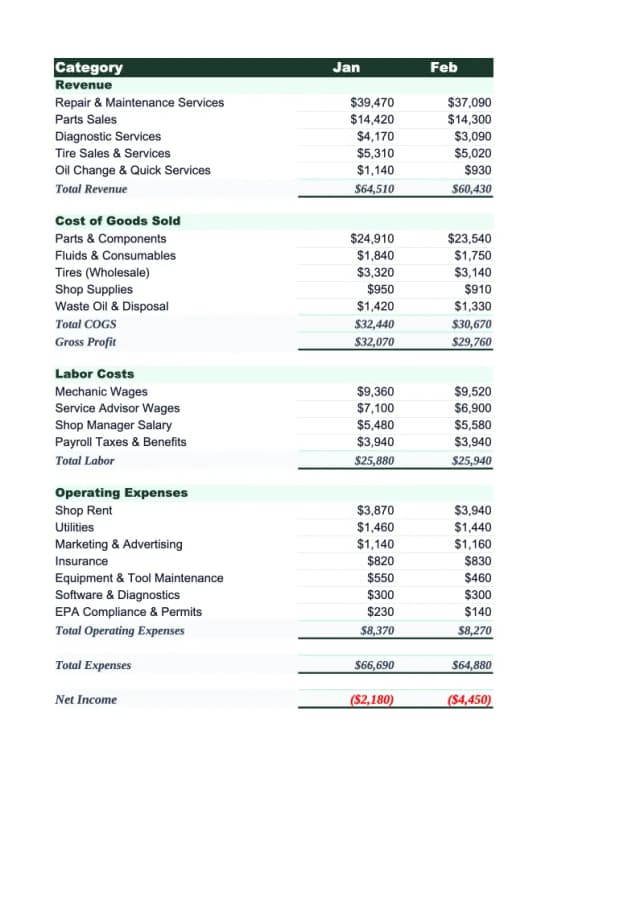
For forward-looking financial planning, the Auto Repair Income Statement Template tracks these same metrics over time. A well-built P&L template gives you a monthly view of labor gross margin, parts gross margin, and net profit together — the three levers that determine whether a shop is making money. The Auto Repair P&L Template is built around how shop financials actually work, with separate lines for labor and parts gross profit. For planning budgets, tracking expenses, or preparing a financial model for a bank loan, the Auto Repair Budget Template and Auto Repair Invoice Template provide the other pieces of the financial picture.
Where to Start
If you don't know whether your current prices are covering your costs, start with the labor rate calculation above. Add up your annual overhead, divide by your actual billed hours (not technician clock hours — billed hours), and check whether that overhead cost is showing up in your posted rate.
Most shops that run this exercise for the first time find that their rate is covering wages and leaving very little for overhead and profit. Some find they're not even covering wages. Either outcome is more useful information than continuing to price based on what the shop down the street is charging.
Last updated: March 25, 2026
Frequently Asked Questions
Related Articles
Cleaning Service Pricing Guide: How to Price Your Business Profitably
A practical guide to cleaning service pricing — covering hourly vs. flat rate vs. per square foot models, price benchmarks by service type, labor cost math, and the common mistakes that keep cleaning businesses from hitting their margin targets.
Construction Pricing Guide: How to Price Your Work Profitably
How contractors should price construction work — covering labor burden, overhead recovery, material markup, pricing methods, and the mistakes that quietly erode margin.
Electrical Pricing Guide: How to Price Your Work Profitably
How electricians and electrical contractors should price their work — covering hourly rates, flat-rate pricing, overhead recovery, material markup, and common mistakes that erode margin.
Hotel Sales Forecast: A Practical Example and Guide
How to build a hotel sales forecast — covering rooms, F&B, events revenue, key metrics like RevPAR and ADR, booking pace, and the rolling forecast structure that keeps you ahead.
Landscaping Pricing Guide: How to Price Your Work Profitably
A practical guide to landscaping pricing — covering hourly rates, per-square-foot benchmarks, overhead recovery, and the markup math that determines whether you're making money.
Manufacturing Inventory Management: Best Practices
Practical manufacturing inventory management best practices — covering ABC analysis, MRP, WIP control, safety stock, and the metrics that matter most on the shop floor.