Retail Income Statement Example: Line Items and Benchmarks
A retail income statement example with line items, gross margin benchmarks by retail type, and a worked P&L for a specialty store — plus what each number means.
Retail income statements follow a specific structure you won't see in service businesses or manufacturing: the multi-step format. It separates the cost of merchandise from operating overhead, creating a gross profit layer that's central to retail analysis. Understanding why that structure exists — and what each section should look like — makes it easier to read any retail P&L, not just your own.
Why Retail Uses the Multi-Step Format
Most service businesses use a single-step income statement: total revenue minus total expenses equals net income. Retail needs more granularity because the cost of selling a product and the cost of running the business are fundamentally different problems.
Gross profit (revenue minus cost of goods) tells you whether your buying and pricing decisions are working. A store with a 28% gross margin and a competitor with a 42% gross margin are in structurally different positions — the first has far less room to cover rent, payroll, and marketing.
Operating income tells you whether the business model is sustainable after overhead. A boutique with high gross margins can still lose money if occupancy costs are too high or staffing is over-built for the volume.
The multi-step format exposes both layers. That's why lenders, investors, and franchise auditors expect to see it.
Revenue: Gross Sales vs. Net Sales
The income statement starts with revenue, but retail P&Ls often distinguish between gross sales and net sales:
- Gross sales — total revenue before deductions
- Less: Sales returns and allowances — merchandise returned by customers
- Less: Sales discounts — promotional discounts, employee discounts, coupons
- = Net sales — the revenue figure used for all subsequent calculations
For most small retailers, this section is straightforward. Returns and discounts are small enough that gross and net sales are nearly identical. But for apparel or electronics retailers with high return rates, the difference matters. A store reporting $800,000 in gross sales with $80,000 in returns is operating on $720,000 — all margin benchmarks should be calculated against net sales, not gross.
Cost of Goods Sold: The Retail Calculation
Retail COGS differs from manufacturing COGS because retailers don't produce what they sell — they buy finished goods and resell them. The calculation reflects that:
COGS = Beginning Inventory + Purchases + Freight-in − Ending Inventory
Each component:
- Beginning inventory — the value of merchandise on hand at the start of the period
- Purchases — merchandise bought from suppliers (net of purchase returns and discounts)
- Freight-in — shipping costs to receive inventory (customs duties for imported goods, inbound freight charges)
- Ending inventory — merchandise on hand at the end of the period, based on physical count or perpetual inventory system
Inventory shrinkage flows through this calculation automatically when you take a physical count. If your perpetual system shows $45,000 in ending inventory but the physical count finds $42,800, the $2,200 difference is recognized as COGS — reducing gross profit. Shrinkage is a retail-specific cost that doesn't appear in service or software businesses. Cycle counting and other inventory management best practices catch these discrepancies before they compound.
Gross Profit and Margin Benchmarks
Gross profit is net sales minus COGS. Gross margin is gross profit as a percentage of net sales. These are the most closely watched metrics in any retail income statement.
Benchmarks vary significantly by retail subsector (NYU Stern, January 2026):
| Retail Subsector | Gross Margin | Operating Margin | Net Margin |
|---|---|---|---|
| Apparel | 56.88% | 10.18% | 3.85% |
| General merchandise | 33.18% | 8.15% | 5.61% |
| Building supply | 34.22% | 12.40% | 7.84% |
| Grocery & food | 26.31% | 2.55% | 1.32% |
| Automotive | 21.96% | 6.51% | 3.36% |
| Home furnishings | 30.28% | 7.19% | 1.10% |
The spread from grocery (26%) to apparel (57%) reflects fundamentally different business models. Grocery competes on price and volume with razor-thin margins; apparel builds margin through brand and product differentiation. A specialty retailer sitting at 30% gross margin in a category where the average is 45% has a problem — either with buying, pricing, or mix.
For most independent retailers outside grocery, a gross margin below 30% makes it very difficult to cover typical operating costs and reach profitability.
Need a ready-made income statement template for your retail?
Download a pre-built spreadsheet with industry-specific categories, formulas, and formatting.
Operating Expenses: What Retail Stores Carry
After gross profit, operating expenses are organized into selling expenses and general & administrative (SG&A) expenses:
Selling and distribution:
- Advertising and marketing (print, digital, social, promotions)
- Visual merchandising and store displays
- Sales commissions (if applicable)
- E-commerce platform fees and fulfillment costs
Occupancy:
- Rent or lease payments
- Common area maintenance (CAM) charges
- Property taxes (if borne by tenant)
- Utilities — electricity, gas, water
Personnel:
- Store staff wages and salaries
- Manager and corporate payroll
- Payroll taxes and benefits
- Overtime and seasonal staffing costs
Depreciation and amortization:
- Store fixtures, shelving, point-of-sale systems
- Leasehold improvements (amortized over lease term)
- IT equipment and software
Other:
- Insurance (property, liability, workers' comp)
- Technology: POS systems, inventory software, e-commerce tools
- Bank and credit card processing fees
- Administrative and professional services
Operating income (EBIT) = Gross Profit − Operating Expenses
The median SG&A as a percentage of revenue in retail trade is approximately 27.59% (OpsDog). Combined with a 33% gross margin, that leaves roughly 5-6% for operating income — consistent with the NYU Stern data showing 8% operating margins for general retail at the better-performing end.
Occupancy is worth watching separately. Healthy occupancy costs — rent plus CAM plus utilities — should stay below 5-10% of revenue for a retail tenant. When occupancy exceeds 12-15% of revenue, the store is usually either underperforming on sales or in the wrong location. Use our retail break-even calculator to see the revenue threshold where occupancy costs become sustainable.
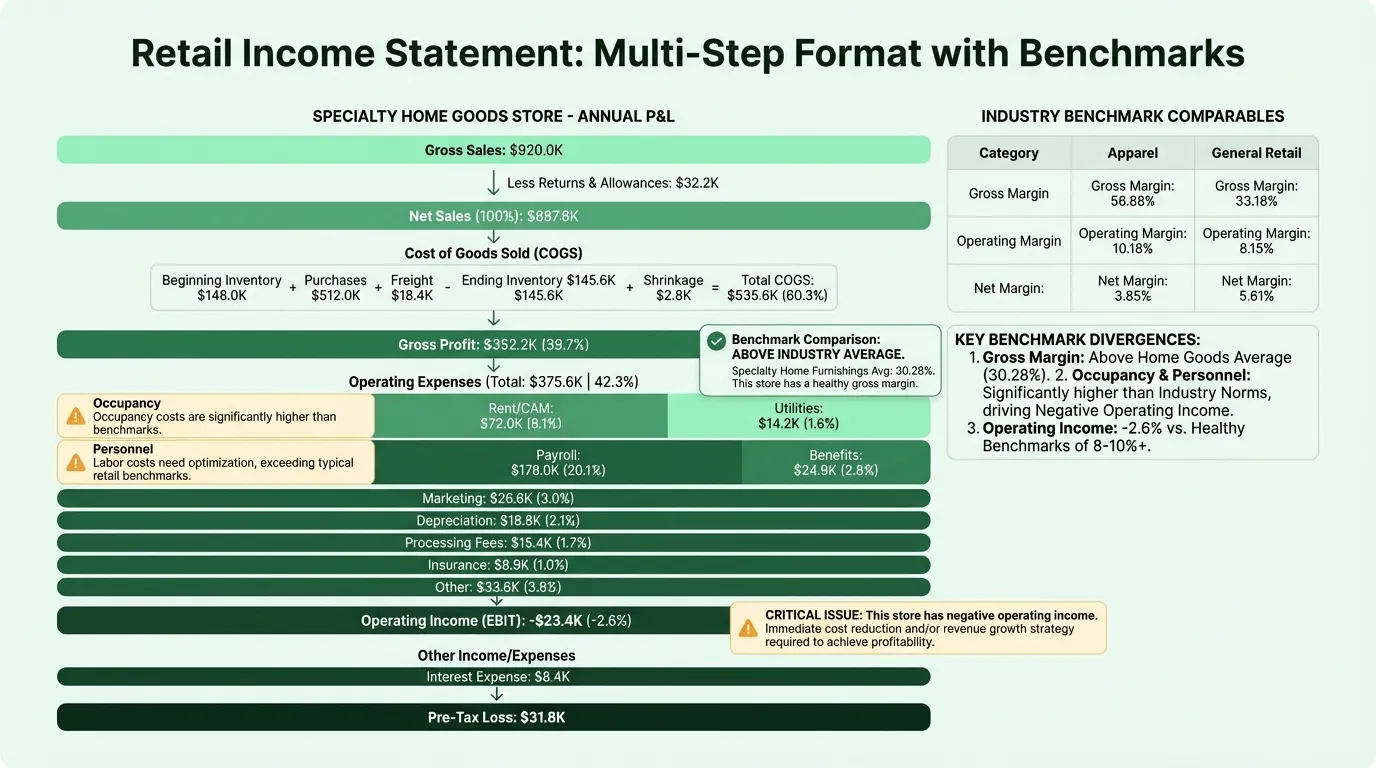
Worked Example: Specialty Home Goods Store
Here's a realistic annual income statement for a single-location specialty home goods retailer:
Revenue
| Line | Annual | % of Net Sales |
|---|---|---|
| Gross sales | $920,000 | — |
| Less: returns and allowances | ($32,200) | — |
| Net sales | $887,800 | 100% |
Cost of Goods Sold
| Line | Annual | % of Net Sales |
|---|---|---|
| Beginning inventory | $148,000 | — |
| Purchases | $512,000 | — |
| Freight-in | $18,400 | — |
| Less: ending inventory | ($145,600) | — |
| Shrinkage adjustment | $2,800 | — |
| Total COGS | $535,600 | 60.3% |
Gross profit: $352,200 (39.7%)
Operating Expenses
| Line | Annual | % of Net Sales |
|---|---|---|
| Rent and CAM | $72,000 | 8.1% |
| Utilities | $14,200 | 1.6% |
| Payroll (store + management) | $178,000 | 20.1% |
| Payroll taxes and benefits | $24,900 | 2.8% |
| Advertising and marketing | $26,600 | 3.0% |
| Depreciation (fixtures, IT) | $18,800 | 2.1% |
| Credit card processing fees | $15,400 | 1.7% |
| Insurance | $8,900 | 1.0% |
| Technology (POS, inventory) | $7,200 | 0.8% |
| Administrative and other | $9,600 | 1.1% |
| Total operating expenses | $375,600 | 42.3% |
Operating income (EBIT): ($23,400) (−2.6%)
This store has a reasonable gross margin (39.7%) for home furnishings — slightly above the NYU Stern average of 30.28% — but operating expenses at 42.3% of net sales exceed gross profit. The result is a small operating loss. The primary pressure is payroll at 20.1%, which would need to drop below 18% or revenue would need to grow to reach breakeven. Reviewing the retail balance sheet alongside this P&L reveals whether inventory buildup or stretched payables are compounding the problem.
Below operating income, the full income statement would include:
| Line | Amount |
|---|---|
| Interest expense (business loan) | ($8,400) |
| Pre-tax loss | ($31,800) |
| Income tax benefit (loss carryforward) | $0 |
| Net loss | ($31,800) |
This is a store that needs to either grow revenue, improve buying margins, or reduce its fixed cost structure — and the income statement shows exactly where to look.
What the Income Statement Tells You (That the Bank Balance Doesn't)
The income statement answers three questions a bank balance can't:
Are your buying decisions working? Gross margin declining quarter-over-quarter signals a problem with supplier pricing, product mix, markdowns, or shrinkage — before it appears as a cash problem.
Where is the overhead going? Operators who think of "expenses" as one number are often surprised when the income statement shows occupancy at 11% and credit card fees at 2.4% — both areas that feel fixed but have levers to pull.
What does growth actually require? A store with a 39% gross margin and fixed costs of $325,000 needs $833,000 in revenue to break even. If current revenue is $750,000, the gap is clear — and the income statement shows whether it's a gross margin problem or an overhead problem.
For a pre-built version in Excel, the Retail Income Statement Template includes the multi-step format with COGS, gross profit, and SG&A sections already structured. If you're tracking budget vs. actual performance, the Retail Budget Template pairs with the income statement for monthly comparisons. For ongoing profitability tracking, the Retail P&L Template provides a rolling view with variance analysis.
Reading the Income Statement Like a Buyer
One thing most retail operators don't do: read their income statement the way a potential acquirer would.
A buyer looks at three numbers first — gross margin percentage, operating income margin, and net margin — and compares them to the benchmarks above. If your gross margin is 10 points below the industry average, they assume either a buying problem or a pricing problem. If your operating margin is at 2% where the category average is 8%, they assume either a cost structure issue or a revenue problem.
Running your own income statement through this lens periodically — not just against your own prior year, but against industry benchmarks — surfaces the same questions a sophisticated buyer would ask. Those are usually the right questions to be asking. For a structured set of the benchmarks that matter most, see our retail KPI examples.
Last updated: March 24, 2026
Frequently Asked Questions
Related Articles
Coffee Shop Income Statement Example: Revenue, Costs, and Margins
A coffee shop income statement example with beverage cost benchmarks, labor targets, prime cost rules, and a worked P&L for an independent café doing $480K/year.
Daycare Income Statement Example: Revenue, Costs, and Margins
A daycare income statement example with tuition revenue, CACFP reimbursements, staff cost benchmarks, and a worked P&L for a 50-child childcare center.
Food Truck Income Statement Example: Line Items and Benchmarks
A food truck income statement example with food cost benchmarks, unique line items like commissary and pitch fees, and a worked P&L for a single-truck operation.
Healthcare Income Statement Example: Revenue, Expenses, and Margins
A healthcare income statement example covering net patient revenue, contractual adjustments, expense benchmarks, and operating margin targets for providers.
Healthcare Pro Forma Example: What to Include and How to Build One
A practical healthcare pro forma example — covering revenue projections, payer mix, expense benchmarks, and a worked model for a new medical practice or service line.
Hotel Pro Forma Example: What to Include and How to Build One
A practical hotel pro forma example — covering RevPAR, GOP, undistributed expenses, FF&E reserves, and a worked model for acquisition or development underwriting.