Restaurant Balance Sheet Example: A Line-by-Line Breakdown
A complete restaurant balance sheet example with real line items, industry benchmarks, and what banks and lenders look at when reviewing your financials.
Your P&L tells you if you made money last month. Your balance sheet tells you if you'll still be standing in six months.
Most restaurant operators watch their P&L closely — food cost, labor, prime cost — but treat the balance sheet as something their accountant handles once a year. That's a mistake. The balance sheet captures things the P&L misses entirely: how much debt you're carrying, how much equity you've built, whether your gift card liability is growing, and whether you have the collateral to get a loan when you need one.
This post walks through a complete restaurant balance sheet example, line by line, with the benchmarks lenders actually use.
The Three Sections of a Restaurant Balance Sheet
Every balance sheet follows the same equation: Assets = Liabilities + Equity. A restaurant balance sheet is no different, but the specific line items reflect the realities of the business — perishable inventory, capital-intensive equipment, long-term building leases, and the gift card liability no other industry talks about as much.
Assets
Current assets are anything you could convert to cash within 12 months:
- Cash and cash equivalents — your checking account and any overnight or money market funds
- Accounts receivable — common for catering operations and corporate accounts; table-service restaurants have minimal AR since customers pay at the point of sale
- Inventory — food, beverage, liquor, and cleaning supplies. Restaurant inventory turns every 9-10 days on average, so this should be a relatively small number. A large inventory balance is a warning sign, not a strength
- Prepaid expenses — insurance premiums paid in advance, security deposits, prepaid software subscriptions
Long-term (non-current) assets are everything the restaurant owns that won't convert to cash within 12 months:
- Kitchen equipment — commercial ranges, refrigeration units, dishwashers, fryers. Often the largest asset on the balance sheet, depreciated over 5-7 years
- Furniture and fixtures — tables, chairs, bar equipment, lighting
- Leasehold improvements — the build-out costs for a rented space. Depreciated over the shorter of the asset's useful life or the remaining lease term
- Technology systems — POS hardware and related equipment
- Right-of-use (ROU) asset — since ASC 842 took effect for private companies in 2022, operating leases must now appear on the balance sheet as assets (and liabilities). For restaurants that rent their space, the ROU asset can be one of the largest line items on the balance sheet
Intangible assets worth noting:
- Liquor licenses — in restricted-license markets (certain states, cities), a liquor license can be worth $50,000-$200,000+. It's a real asset that should be capitalized
- Franchise fees — paid as a lump sum, amortized over 15 years for tax purposes
- Goodwill — primarily shows up when a restaurant is acquired at a price above book value
Liabilities
Current liabilities are obligations due within 12 months:
- Accounts payable — outstanding vendor invoices for food, beverage, and supplies. Should align with your typical payment terms (net-7 to net-30)
- Accrued wages and tips — wages earned but not yet paid, plus collected tips before remittance to staff
- Gift card liability (deferred revenue) — sold but unredeemed gift cards. This is a liability, not revenue, until the guest actually orders. Restaurants with active gift card programs carry a persistent deferred revenue balance that should be reviewed alongside the restaurant profit and loss example to understand its impact on reported profitability
- Sales tax payable — collected from customers at point of sale, held until remittance
- Current portion of equipment loans — the principal due in the next 12 months on any equipment financing
- Current portion of operating lease — the lease payments due in the next 12 months under ASC 842
Long-term liabilities:
- Equipment loans (long-term portion) — remaining principal on kitchen and equipment financing beyond 12 months
- Operating lease liability — the long-term portion of the lease obligation brought onto the balance sheet under ASC 842. For a restaurant with a 10-year lease, this can be a large number
- SBA or other term loans — the long-term portion of any business loans
Equity
For a sole proprietorship or partnership: owner's investment plus retained earnings (cumulative net profits kept in the business rather than withdrawn).
For a corporation: common stock, additional paid-in capital, and retained earnings.
Retained earnings build over time when the restaurant is profitable and the owner doesn't withdraw all profits. This is the mechanism by which equity grows — slowly, given that restaurant net margins run 3-5%.
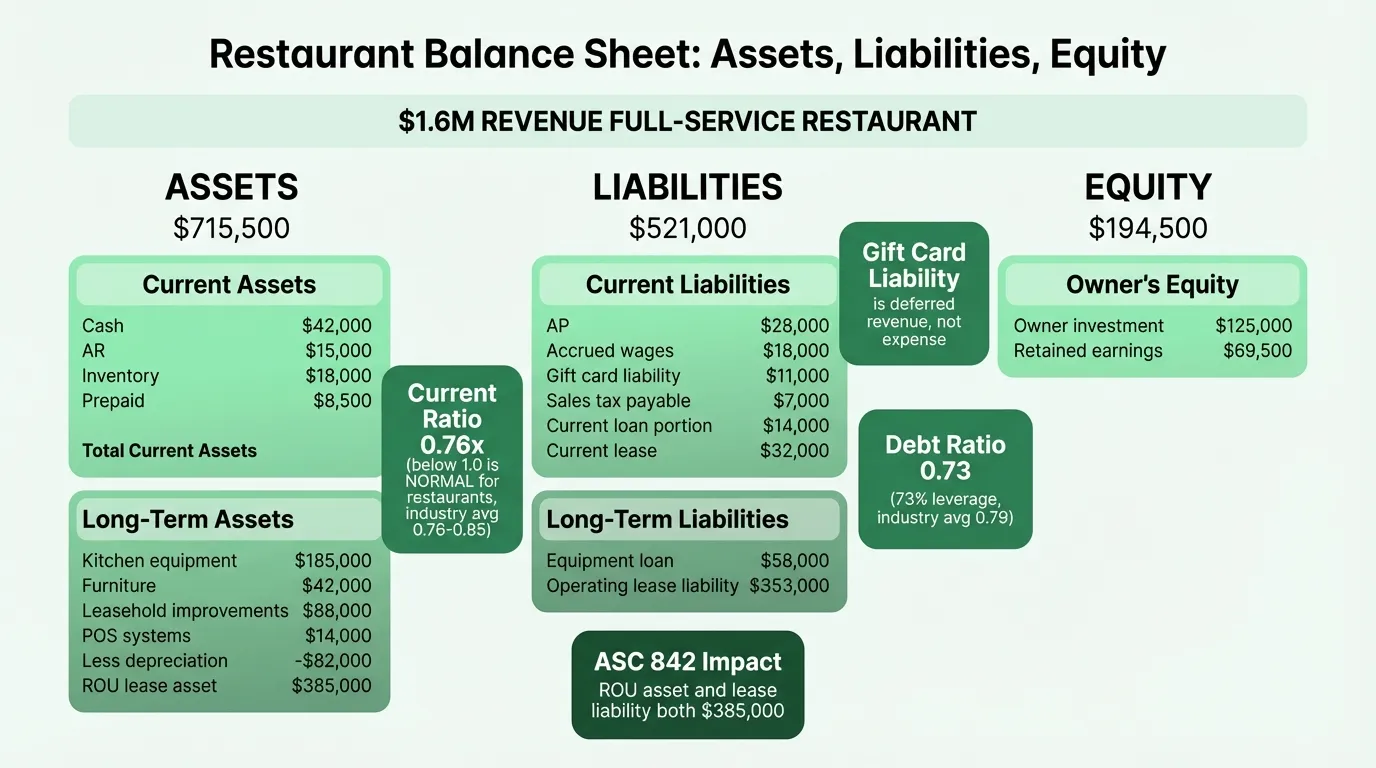
Complete Example: Full-Service Restaurant
Here's a representative balance sheet for a full-service restaurant doing approximately $1.6M in annual sales, three years into operation:
Assets
Current Assets
| Line Item | Amount |
|---|---|
| Cash and cash equivalents | $42,000 |
| Accounts receivable (catering) | $15,000 |
| Inventory (food, beverage, liquor) | $18,000 |
| Prepaid expenses | $8,500 |
| Total Current Assets | $83,500 |
Long-Term Assets
| Line Item | Amount |
|---|---|
| Kitchen equipment | $185,000 |
| Furniture and fixtures | $42,000 |
| Leasehold improvements | $88,000 |
| POS and technology systems | $14,000 |
| Less: accumulated depreciation | ($82,000) |
| Right-of-use asset (operating lease) | $385,000 |
| Total Long-Term Assets | $632,000 |
Total Assets: $715,500
Liabilities
Current Liabilities
| Line Item | Amount |
|---|---|
| Accounts payable (vendor invoices) | $28,000 |
| Accrued wages and tips | $18,000 |
| Gift card liability | $11,000 |
| Sales tax payable | $7,000 |
| Current portion of equipment loan | $14,000 |
| Current portion of operating lease | $32,000 |
| Total Current Liabilities | $110,000 |
Long-Term Liabilities
| Line Item | Amount |
|---|---|
| Equipment loan (long-term portion) | $58,000 |
| Operating lease liability (long-term) | $353,000 |
| Total Long-Term Liabilities | $411,000 |
Total Liabilities: $521,000
Equity
| Line Item | Amount |
|---|---|
| Owner's initial investment | $125,000 |
| Retained earnings | $69,500 |
| Total Equity | $194,500 |
Total Liabilities + Equity: $715,500
What the Numbers Actually Mean
The Current Ratio
Current Ratio = Current Assets / Current Liabilities
In this example: $83,500 / $110,000 = 0.76
This is below 1.0, which means current liabilities exceed current assets. For most businesses, a current ratio below 1.0 is a red flag. For restaurants, it's normal.
Why? Because restaurants operate with essentially no accounts receivable — customers pay immediately — while vendor invoices accumulate on 7-30 day terms. The business model generates working capital float, not working capital reserves. According to data from publicly traded restaurant companies (SEC filings for SIC code 58), the industry average current ratio was 0.76 in 2024, 0.85 in 2023, and 0.97 in 2022.
A current ratio below 0.5, or one that's declining rapidly, does warrant attention — especially if the restaurant lacks a credit line. But 0.7-0.9 is operating range for a well-run restaurant.
Debt Ratio and Leverage
Debt Ratio = Total Liabilities / Total Assets
In this example: $521,000 / $715,500 = 0.73
This means 73 cents of every dollar in assets is financed by debt or obligations. The restaurant industry average is approximately 0.79. High leverage is structural in restaurants: the buildout is expensive, most operators don't own their building, and kitchen equipment is financed. The introduction of lease accounting (ASC 842) pushed leverage ratios higher across the industry starting in 2022 because multi-year lease obligations moved onto the balance sheet.
A debt ratio above 0.90 should trigger concern. A debt ratio below 0.70 in a restaurant typically indicates either a cash-strong operation or one with minimal lease obligations (e.g., a food truck or counter-service concept in a low-rent location).
Equity Trends
In this example, the restaurant has $194,500 in total equity — $69,500 of which is retained earnings accumulated over three years of profitable operations. If net margin is 3-4% on $1.6M in sales, retained earnings grow by roughly $48,000-$64,000 per year (before owner draws).
Equity is slow to build in restaurants. A restaurant that has operated profitably for five years and still shows negative equity — where liabilities exceed assets — has likely been distributing all profits rather than retaining any, or has accumulated debt beyond what operations can support.
Need a ready-made balance sheet template for your restaurant?
Download a pre-built spreadsheet with industry-specific categories, formulas, and formatting.
Restaurant-Specific Balance Sheet Items to Watch
Gift Card Liability
Many operators underestimate how material this line can become. A restaurant doing $1.6M in annual sales that runs gift card promotions can easily carry $10,000-$30,000 in unredeemed gift card liability. This isn't a problem — it's cash you've collected in advance — but it's debt until the guest walks in. Track it separately so you understand your true cash position.
Leasehold Improvements
When you renovate a rented space, the cost goes on your balance sheet as a leasehold improvement and is depreciated over the useful life of the improvement or the remaining lease term, whichever is shorter. If your lease has 4 years left and you do $80,000 in renovations, you're depreciating $20,000 per year. This has real implications for profitability and taxes — and it's a reason to negotiate longer lease terms before investing in major build-outs. For a breakdown of how these capital costs factor into an opening budget, see the restaurant startup costs example.
Operating Lease ROU Asset (ASC 842)
Before 2022, restaurant operating leases were off-balance-sheet — you'd see rent as a monthly expense on the P&L but nothing on the balance sheet. ASC 842 changed this. Now the present value of all remaining lease payments appears as both an asset (right-of-use asset) and a liability (lease obligation). For a restaurant with a 10-year lease at $8,000/month, the ROU asset and corresponding liability can each be $700,000-$800,000.
This doesn't change the economics of the business — your rent payment is the same. But it does change how your balance sheet looks and how leverage ratios are calculated. If you're comparing your balance sheet to older industry benchmarks, the difference may partly be ASC 842.
What Lenders Look At
When you apply for an SBA loan, equipment financing, or a business line of credit, the lender will review your balance sheet alongside your P&L and cash flow statement. The specific things they examine:
| What They Check | What They Want to See |
|---|---|
| Current ratio | Positive trend; not in freefall |
| Debt ratio | Below 0.85 for new credit |
| Equity trend | Growing over time (profitable and retaining earnings) |
| Inventory balance | Small and consistent — proportional to sales volume |
| Leasehold improvements | Amortized correctly; remaining lease term |
| Collateral | Equipment, fixtures — what can secure the loan? |
| Personal guarantee | For most small restaurant loans, owner's personal assets |
A balance sheet with growing retained earnings, a stable debt ratio, and identifiable collateral tells a lender that the restaurant is managed with financial discipline. Use the restaurant break-even calculator to determine the revenue level needed to maintain positive equity growth. One with negative equity, large gift card liabilities that aren't being worked down, and maxed-out accounts payable raises questions.
Using the Balance Sheet as a Management Tool
Monthly P&L review is standard practice for well-run restaurants. Monthly balance sheet review is less common — and that's a gap.
The specific things to check each month:
- Inventory balance — if inventory is growing relative to sales, you're over-purchasing or over-producing. A food cost problem often shows up on the balance sheet as creeping inventory before it's obvious on the P&L
- Accounts payable — if AP is growing month over month, you're falling behind on vendor payments. This can cascade into supply disruptions
- Gift card liability trend — is it growing? That's fine if you're selling more cards than you're redeeming. Is it flat? That means redemptions are keeping pace with sales
- Equity trend — are retained earnings growing? If not, the business is breaking even at best or consuming equity
The Restaurant Balance Sheet Template is structured for this monthly review — with both the balance sheet itself and the ratio calculations built in. For a complete financial picture, it pairs with the Restaurant P&L Template (which covers profitability in detail) and the Restaurant Cash Flow Template (which tracks when money actually moves in and out of the account).
Three documents, three questions: the balance sheet asks what you own and owe, the P&L asks whether you're profitable, and the cash flow statement asks whether you can make payroll. None of them answers the others.
Last updated: March 24, 2026
Frequently Asked Questions
Related Articles
Church Accounting Best Practices: A Practical Guide
How church accounting works — fund accounting, restricted funds, internal controls, financial reports, and the tax rules that catch churches off guard.
Church Balance Sheet Example: A Line-by-Line Breakdown
A complete church balance sheet example with real line items, fund accounting explained, and the benchmarks church boards use to assess financial health.
Construction Accounting: A Practical Guide for Contractors
Construction accounting is different from standard accounting. This guide covers job costing, WIP schedules, retainage, revenue recognition methods, and common mistakes.
Construction Balance Sheet Example: A Line-by-Line Breakdown
A complete construction company balance sheet example with real line items, WIP accounting, retainage, overbilling, and what sureties and lenders look for.
Daycare Balance Sheet Example: Line by Line
A complete daycare balance sheet example with real line items — enrollment deposits, playground equipment, subsidy receivables, and what the numbers mean.
Food Truck Balance Sheet Example: A Line-by-Line Breakdown
A complete food truck balance sheet example with real line items, truck depreciation rules, and what makes a food truck's financials different from a restaurant.