Hotel Income Statement Example: Structure, Benchmarks, and a Worked P&L
A practical hotel income statement example using USALI format — with departmental P&L structure, GOP benchmarks, and a full worked example for a 100-room property.
A restaurant income statement has one revenue line and one cost structure. A hotel income statement has a completely different architecture — one that tracks revenue and expenses by department, not just in aggregate. Understanding that structure is the first step to using hotel financials as a management tool.
How a Hotel Income Statement Is Organized
Hotels follow the Uniform System of Accounts for the Lodging Industry (USALI) — a standardized accounting format that's been the industry standard since 1926. USALI divides the P&L into three tiers, each with a different purpose.
Tier 1: Operated Departments
Each revenue-generating department gets its own mini income statement showing revenue, payroll, other expenses, and departmental income. The main departments are:
- Rooms — transient rooms, group rooms, package revenue
- Food & Beverage — restaurant, bar, banquets, room service, mini-bar
- Other Operated Departments — spa, parking, retail, golf, health club
The rooms department has no cost of goods sold. Its costs are labor (front desk, housekeeping, concierge) and "other" expenses (OTA commissions, guest amenities, in-room supplies, reservation fees). F&B tracks both food and beverage cost percentages alongside labor and operating expenses.
Tier 2: Undistributed Operating Expenses
These are shared overhead departments with no direct revenue. Under the current USALI 11th edition, there are five:
- Administrative & General (A&G) — management, accounting, HR, IT overhead, credit card commissions
- Information & Telecommunications Systems (I&T) — PMS/POS systems, hardware, cybersecurity
- Sales & Marketing (S&M) — sales team, advertising, franchise marketing fees, PR
- Property Operations & Maintenance (POM) — engineering, preventive maintenance, repairs, grounds
- Utilities — electricity, gas, water, waste
Undistributed expenses are analyzed as a percentage of total hotel revenue, not department revenue.
Tier 3: Fixed Charges and Below
Fixed charges sit below Gross Operating Profit (GOP) and include management fees, property taxes, insurance, and the FF&E (furniture, fixtures & equipment) reserve. Depreciation and interest expense appear below Net Operating Income (NOI).
This three-tier structure produces four key subtotals:
| Subtotal | What It Measures |
|---|---|
| Departmental Income | Revenue from operated departments minus their direct costs |
| Gross Operating Profit (GOP) | Departmental income minus undistributed expenses |
| Net Operating Income (NOI) | GOP minus management fees and fixed charges |
| Net Income Before Tax | NOI minus depreciation and interest |
Revenue Benchmarks by Property Type
The mix between rooms revenue and other revenue differs significantly by hotel type:
| Hotel Type | Rooms Revenue % | F&B Revenue % |
|---|---|---|
| Limited-service / Extended-stay | 97%+ | 0–3% |
| Full-service (city/convention) | 60–70% | 25–35% |
| Resort hotels | ~52% | 30–40% |
| Full-service industry average | ~68% | ~29–32% |
Source: CBRE Hotels Research, Trends in the Hotel Industry
This split matters because rooms and F&B have different cost structures. Rooms are high-margin; F&B is labor-intensive with tighter margins. A resort with 40% of revenue in F&B will have a lower overall GOP margin than a limited-service hotel where rooms generate nearly all revenue. Run your property's revenue mix through the hotel profit margin calculator to see how your departmental split compares to these benchmarks.
Key top-line metrics to track:
- ADR (Average Daily Rate) — rooms revenue divided by rooms sold. 2025 national average: approximately $162; upscale full-service: $188–$225.
- Occupancy rate — rooms sold divided by rooms available. 2024 U.S. average: 63.0% (still slightly below 2019's pre-pandemic 65.8%, per AHLA data).
- RevPAR (Revenue Per Available Room) — ADR × occupancy. 2025 upscale segment median: ~$133.
- GOPPAR (GOP Per Available Room) — GOP divided by available rooms. Measures profitability per room, accounting for costs.
Cost Benchmarks by Category
Rooms Department
Historical rooms department expense runs 24–28% of rooms revenue (CBRE). The biggest line items are housekeeping labor and OTA/travel agent commissions — typically 8–12% of rooms revenue on its own for hotels with high OTA mix.
In 2024, two rooms-related costs increased faster than overall revenue: agency commissions rose 6.0% and complimentary F&B rose 3.9% year-over-year, according to CBRE Hotels Research.
Food & Beverage Department
F&B department profit margin improved from 23.6% in 2021 to 29.3% in 2022 as travel demand recovered (CBRE). The main costs are food/beverage cost (typically 28–33% of F&B revenue) and F&B labor (40–45% of F&B revenue). Full-service hotels carry F&B as a strategic amenity even when its margins are thin.
Labor — The Largest Line Item
Total labor reached 34.4% of revenue in 2024 — up from historical norms of 31–32% — according to CBRE. Total compensation in accommodation & food service rose 26.5% from 2020 to 2024 (HVS, citing BLS data). This cost inflation is the primary reason why GOP margins have compressed across full-service properties.
Undistributed Expenses — Typical Ranges
| Category | Typical % of Total Revenue |
|---|---|
| Administrative & General | 6–8% |
| Sales & Marketing | 4–6% |
| Property Operations & Maintenance | 4–6% |
| Utilities | 3–5% |
In 2024, total expenses above the GOP line grew 4.1% year-over-year, while total revenue grew only 2.3% (CBRE). Maintenance costs rose 5.0% and I&T costs rose 5.1% — both outpacing revenue growth significantly. The Hotel Expense Tracker Template helps you monitor these undistributed categories month over month before they erode your GOP.
GOP Margins by Segment
| Segment | Typical GOP Margin |
|---|---|
| Full-service (industry average) | 25–35% |
| Limited-service | 35–40% |
| Select-service / Extended-stay | 40–50% |
| U.S. industry average (2024) | 35.4% |
| Upper Midscale YTD 2025 | 44.8% |
| Upscale YTD 2025 | 40.1% |
Sources: STR 2024 data; HotelData.com Q3 2025 Profit Report
Need a ready-made income statement template for your hotel?
Download a pre-built spreadsheet with industry-specific categories, formulas, and formatting.
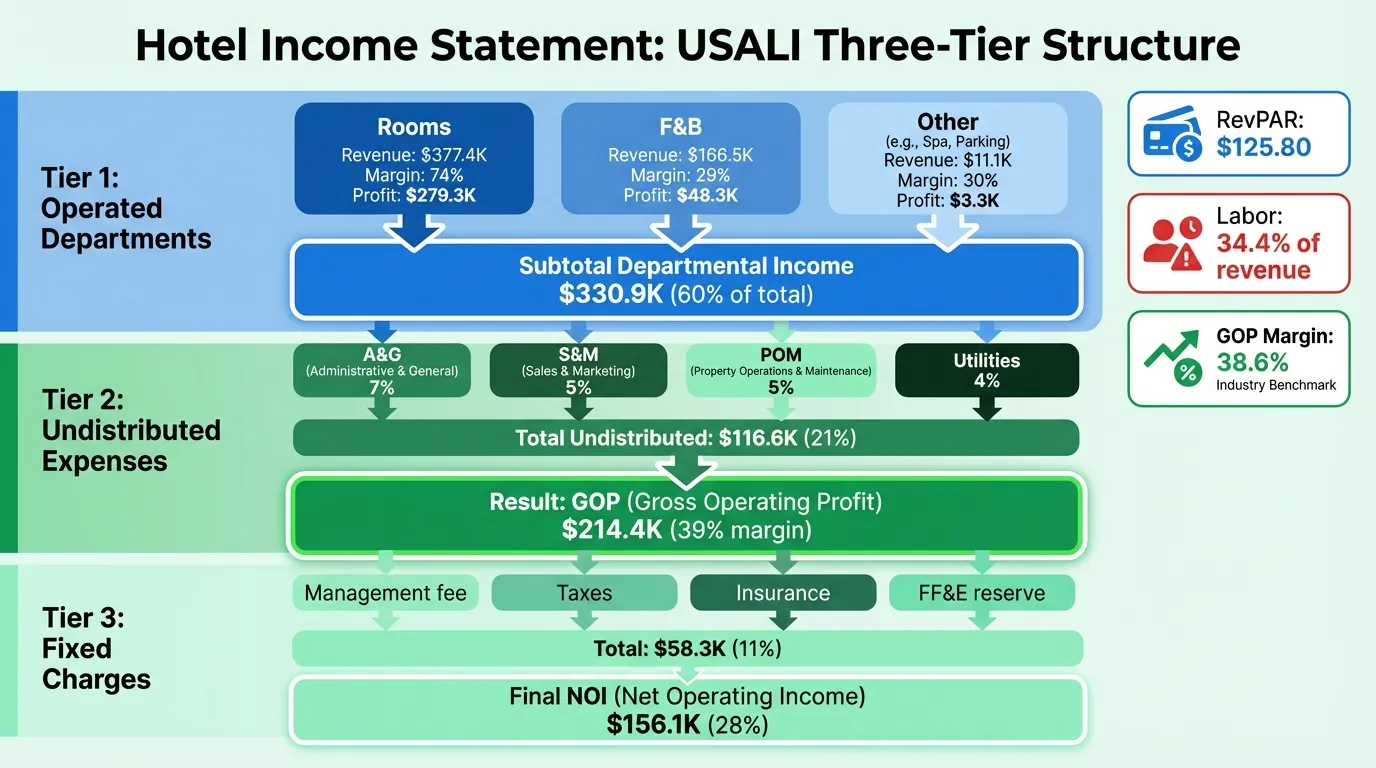
Worked Example: 100-Room Upscale Full-Service Hotel
Here's a monthly income statement for a full-service property in a mid-sized market — a realistic illustration of how the numbers flow from revenue to NOI.
Assumptions: 100 rooms, 68% occupancy, $185 ADR, July (30-day month) Room nights sold: 100 × 30 × 68% = 2,040
Revenue
| Department | Monthly Amount | % of Total |
|---|---|---|
| Rooms | $377,400 | 68% |
| Food & Beverage | $166,500 | 30% |
| Other Operated (spa, parking) | $11,100 | 2% |
| Total Revenue | $555,000 | 100% |
RevPAR: $377,400 ÷ (100 rooms × 30 days) = $125.80
Operated Department Income
| Department | Revenue | Expenses | Income | Margin |
|---|---|---|---|---|
| Rooms | $377,400 | $98,100 | $279,300 | 74.0% |
| Food & Beverage | $166,500 | $118,200 | $48,300 | 29.0% |
| Other Operated | $11,100 | $7,800 | $3,300 | 29.7% |
| Total Dept. | $555,000 | $224,100 | $330,900 | 59.6% |
Rooms expenses breakdown (26% of rooms revenue):
- Labor (front desk, housekeeping): $66,500
- OTA/travel agent commissions: $19,600
- Guest amenities and supplies: $9,400
- Other: $2,600
F&B expenses breakdown (71% of F&B revenue):
- Food and beverage cost (30%): $50,000
- F&B labor (38%): $63,300
- Other F&B expenses (3%): $4,900
Undistributed Operating Expenses
| Category | Amount | % of Revenue |
|---|---|---|
| Administrative & General | $38,850 | 7.0% |
| Sales & Marketing | $27,750 | 5.0% |
| Property Operations & Maintenance | $27,750 | 5.0% |
| Utilities | $22,200 | 4.0% |
| Total Undistributed | $116,550 | 21.0% |
Gross Operating Profit
| Amount | % of Revenue | |
|---|---|---|
| Total Departmental Income | $330,900 | 59.6% |
| Less: Undistributed Expenses | ($116,550) | (21.0%) |
| Gross Operating Profit (GOP) | $214,350 | 38.6% |
Fixed Charges
| Category | Amount | % of Revenue |
|---|---|---|
| Management fee (3%) | $16,650 | 3.0% |
| Property taxes | $11,100 | 2.0% |
| Insurance | $8,325 | 1.5% |
| FF&E reserve (4%) | $22,200 | 4.0% |
| Total Fixed Charges | $58,275 | 10.5% |
Net Operating Income
| Amount | % of Revenue | |
|---|---|---|
| Gross Operating Profit | $214,350 | 38.6% |
| Less: Fixed Charges | ($58,275) | (10.5%) |
| Net Operating Income (NOI) | $156,075 | 28.1% |
This property lands at a 38.6% GOP margin — consistent with the U.S. industry average of 35.4% for 2024. Below NOI, depreciation ($30,000/month) and interest expense ($55,000/month on typical hotel debt) would reduce net income before tax to approximately $71,000 — or about 12.8% of total revenue for a well-performing stabilized asset.
The Hotel Income Statement Template follows this USALI-aligned structure with separate department schedules and percentage columns for benchmarking each line.
GOP vs. Net Profit: Why the Gap Is So Wide
A 38% GOP margin sounds healthy. By the time you reach net income before tax, you might be at 5–10%. Here's where the difference goes:
- Management fees: Base fees of 2–4% of total revenue are standard for branded or managed hotels. Incentive fees (typically 10% of GOP above a threshold) add more.
- Property taxes and insurance: Combined, often 3–4% of revenue.
- FF&E reserve: Franchise agreements typically require 4–5% of revenue set aside for capital replacement. This is real cash out the door even if it doesn't show as an operating expense.
- Depreciation: A hotel is a capital-intensive asset. Annual depreciation of $3–5 million is common for mid-size properties.
- Interest expense: Most hotel acquisitions are 60–70% debt-financed. Debt service is a large fixed burden.
This is why hotel valuation focuses on NOI and GOP — not net income. Buyers and lenders care about what the asset generates before ownership-level costs, which vary by capital structure. For a full acquisition model showing how GOP flows into cap rate and IRR calculations, see the hotel pro forma example.
How to Use the Income Statement Monthly
The hotel income statement is most useful as a monthly management tool when it includes budget-vs-actual comparisons. The review process:
- Check RevPAR first — if rooms revenue is below budget, everything downstream will be under pressure
- Review rooms department expense % — is housekeeping labor in range? Are OTA commissions rising as a percentage?
- Review F&B margin — a 29% departmental margin is the 2022 industry benchmark; anything below 25% warrants investigation into food cost or labor scheduling
- Total labor as % of revenue — if it's approaching or above 35%, you're running at the high end of the industry range. A well-structured hotel budget sets these targets by department before the period starts
- Compare GOP % — your single best summary metric for operating performance
Two other financial documents complete the picture alongside the income statement:
- Hotel Budget Template — set revenue and expense targets before the period, then compare against actual income statement results
- Hotel Cash Flow Template — track when cash actually moves, separate from when revenue is accrued; particularly important for hotels with group bookings and deposits collected months before the stay
The income statement tells you whether the hotel was profitable. Cash flow tells you whether it can meet payroll, debt service, and FF&E reserve contributions on time. Both documents answer different questions.
Last updated: March 23, 2026
Frequently Asked Questions
Related Articles
Coffee Shop Income Statement Example: Revenue, Costs, and Margins
A coffee shop income statement example with beverage cost benchmarks, labor targets, prime cost rules, and a worked P&L for an independent café doing $480K/year.
Daycare Income Statement Example: Revenue, Costs, and Margins
A daycare income statement example with tuition revenue, CACFP reimbursements, staff cost benchmarks, and a worked P&L for a 50-child childcare center.
Food Truck Income Statement Example: Line Items and Benchmarks
A food truck income statement example with food cost benchmarks, unique line items like commissary and pitch fees, and a worked P&L for a single-truck operation.
Healthcare Income Statement Example: Revenue, Expenses, and Margins
A healthcare income statement example covering net patient revenue, contractual adjustments, expense benchmarks, and operating margin targets for providers.
Healthcare Pro Forma Example: What to Include and How to Build One
A practical healthcare pro forma example — covering revenue projections, payer mix, expense benchmarks, and a worked model for a new medical practice or service line.
Hotel Pro Forma Example: What to Include and How to Build One
A practical hotel pro forma example — covering RevPAR, GOP, undistributed expenses, FF&E reserves, and a worked model for acquisition or development underwriting.