Coffee Shop Budget Example: Real Numbers and Benchmarks
A practical coffee shop budget example with real cost benchmarks — covering beverage COGS, labor, rent, equipment maintenance, and the line items most operators underestimate.
Beverage margins on a latte look extraordinary — $5 in revenue on $1.25 of input cost is an 75% gross margin. So why do so many coffee shops struggle to turn a profit?
The answer is in the full budget, not just the drink math. Labor is high, equipment maintenance is ongoing, rent in foot-traffic-heavy locations is expensive, and the morning-peak scheduling structure makes labor hard to flex. Understanding how each cost category interacts is how you build a budget that holds up in practice.
Revenue Categories
A coffee shop's revenue splits across three streams, each with different cost structures:
Beverages (typically 60–70% of revenue): Espresso drinks, drip coffee, cold brew, tea, and seasonal specials. This is the core of the business and carries the highest gross margins — 70–80% on specialty drinks.
Food (typically 20–30% of revenue): Pastries, sandwiches, salads, and grab-and-go items. Gross margins here are lower — 60–70% on fresh-baked items, sometimes higher on pre-packaged goods. Food adds transaction size but also operational complexity and waste risk.
Retail (typically 5–10% of revenue): Whole-bean coffee, branded merchandise, brewing equipment. Margins on packaged beans can reach 80–90%, making retail one of the best-margin revenue streams in the business. Under-utilized by most independent shops.
Track these separately. A shop doing 70% beverage / 30% food will have materially lower blended COGS than one doing 50/50 — the revenue mix directly affects your overall profitability picture. For a deeper look at how each revenue stream flows to the bottom line, see our coffee shop income statement example.
Beverage and Food Cost (COGS)
Beverage COGS should run 20–30% of beverage sales, targeting the lower half of that range for espresso-based drinks and the higher end for items with more expensive ingredients (specialty matcha, premium syrups, non-dairy alternatives).
Food COGS runs 30–40% of food sales for fresh-baked items and closer to 40–50% for cold sandwiches and refrigerated items. If you're sourcing from an external bakery, food cost will run higher than if you're baking in-house — but baking in-house adds labor and equipment costs that offset some of the COGS savings.
Blended COGS target: 28–35% of total revenue. A shop running above 35% either has a revenue mix problem (too much low-margin food), a purchasing problem, or both.
Two line items that catch operators off guard:
Milk alternatives. Oat milk, almond milk, and other alternatives cost two to three times conventional dairy but are now a standard expectation, not a specialty request. If 30–40% of your drink orders use alternative milk, this materially affects your beverage COGS. Budget it explicitly rather than absorbing it into a generic "dairy" line.
Coffee bean cost volatility. Arabica coffee prices hit $4.41 per pound in early 2026 — well above the five-year average — driven by supply constraints in key growing regions. Specialty-grade wholesale beans run $14–$18/kg ($6.50–$8/lb) even in normal markets. If your menu prices haven't been reviewed in 18 months and input costs have moved significantly, your COGS percentages will show it. Run updated numbers through the coffee shop food cost calculator to see how bean price changes affect your per-drink margins.
Labor
Labor is the largest expense for most coffee shops — and the hardest to control because of the morning-peak scheduling problem.
Industry target: 25–35% of revenue. Urban shops with higher minimum wages and specialty-trained baristas tend to run at the higher end. Suburban shops with lower wage floors typically land 25–30%.
Your labor budget should include:
- Barista wages — specialty-trained baristas earn $15–$22/hour in most urban markets; budget the actual rate you're paying, not a generic QSR benchmark
- Management and shift lead salaries — typically 8–12% of revenue on its own
- Payroll taxes — Social Security, Medicare, FUTA, SUTA (adds approximately 10–12% to wage cost)
- Workers' compensation insurance — rates vary by state
- Benefits — health insurance, paid leave, any retirement match
The scheduling challenge: most coffee shops do 60–70% of daily sales during a two-hour morning window (7–9 AM) and a smaller afternoon peak (2–4 PM). You need full staffing during those periods, but maintaining that staffing through slow midday hours inflates hourly labor cost. Shops that schedule aggressively for the morning peak and reduce afternoon coverage significantly run lower labor percentages than those that maintain consistent staffing all day.
Equipment Maintenance
This is the line item most budget templates omit — and the one that surprises new operators most.
A commercial espresso machine is the heart of the operation. When it goes down, revenue stops. Preventive maintenance costs $200–$400 per quarter for a two-group machine. An emergency repair call — when the machine fails on a Saturday morning — runs $300–$800 just for the service call before parts. Annual maintenance budget for a commercial espresso setup: $1,500–$3,000 depending on machine age, usage volume, and water quality.
Water quality matters more than most operators expect. Hard water damages heating elements and groupheads over time. A commercial water filtration system costs $800–$2,500 installed, with filter replacement running $200–$600 per year. It's a real cost, but far cheaper than a premature equipment replacement or chronic repair bills.
Budget equipment maintenance and filtration as a fixed line item — roughly 1–1.5% of revenue — rather than treating repairs as a surprise. Operators who set aside a monthly maintenance reserve rarely face genuine emergencies.
Occupancy
Rent is one of the most consequential decisions in a coffee shop's life, and it's almost impossible to fix once you sign the lease.
Target: rent at 5–10% of gross revenue. Well-run independent shops aim for 5–7%. Urban locations with high foot traffic often run 8–10% and can support it through higher transaction volume. Any rent commitment above 10% of projected sales makes profitability very difficult even with tight COGS and labor.
The problem: many coffee shop operators sign leases based on projected revenue before the business is established. If your actual revenue comes in 20% below projections, a rent that was 7% of projected sales becomes 9% of actual sales.
Budget conservatively. Use 80–90% of your projected revenue when calculating whether a location's rent is affordable.
Utilities — electricity, gas, water, garbage — add another 2–4% of revenue. Coffee shops are energy-intensive: commercial espresso machines, refrigeration, HVAC, lighting. Budget utilities as a monthly dollar amount based on comparable locations, then monitor as a percentage of sales.

Need a ready-made budget template for your coffee shop?
Download a pre-built spreadsheet with industry-specific categories, formulas, and formatting.
Other Operating Expenses
| Category | Typical Range |
|---|---|
| Credit card processing | 2.5–3.5% of sales |
| Insurance (property, liability, product) | 1.5–2.5% of sales |
| Marketing and loyalty programs | 1–3% of sales |
| Equipment maintenance and filtration | 1–1.5% of sales |
| POS, scheduling, and tech subscriptions | 0.5–1% of sales |
| Cleaning supplies and smallwares | 0.5–1% of sales |
| Music licensing (ASCAP/BMI) | $300–$600/year |
| Accounting and legal | 0.5–1% of sales |
| Contingency | 2–3% of expenses |
Credit card processing is easy to underestimate. At 2.5–3.5% of sales, a coffee shop doing $420,000 annually is paying $10,500–$14,700 in processing fees. That's worth a line item in the budget rather than burying it in miscellaneous.
Music licensing surprises first-time owners. If you play music in your shop — through streaming services like Spotify or Apple Music — you still need a commercial license. ASCAP, BMI, and SESAC each cover different rights holders; most shops need at least two licenses. Budget $300–$600 per year total.
Example: Independent Coffee Shop Annual Budget
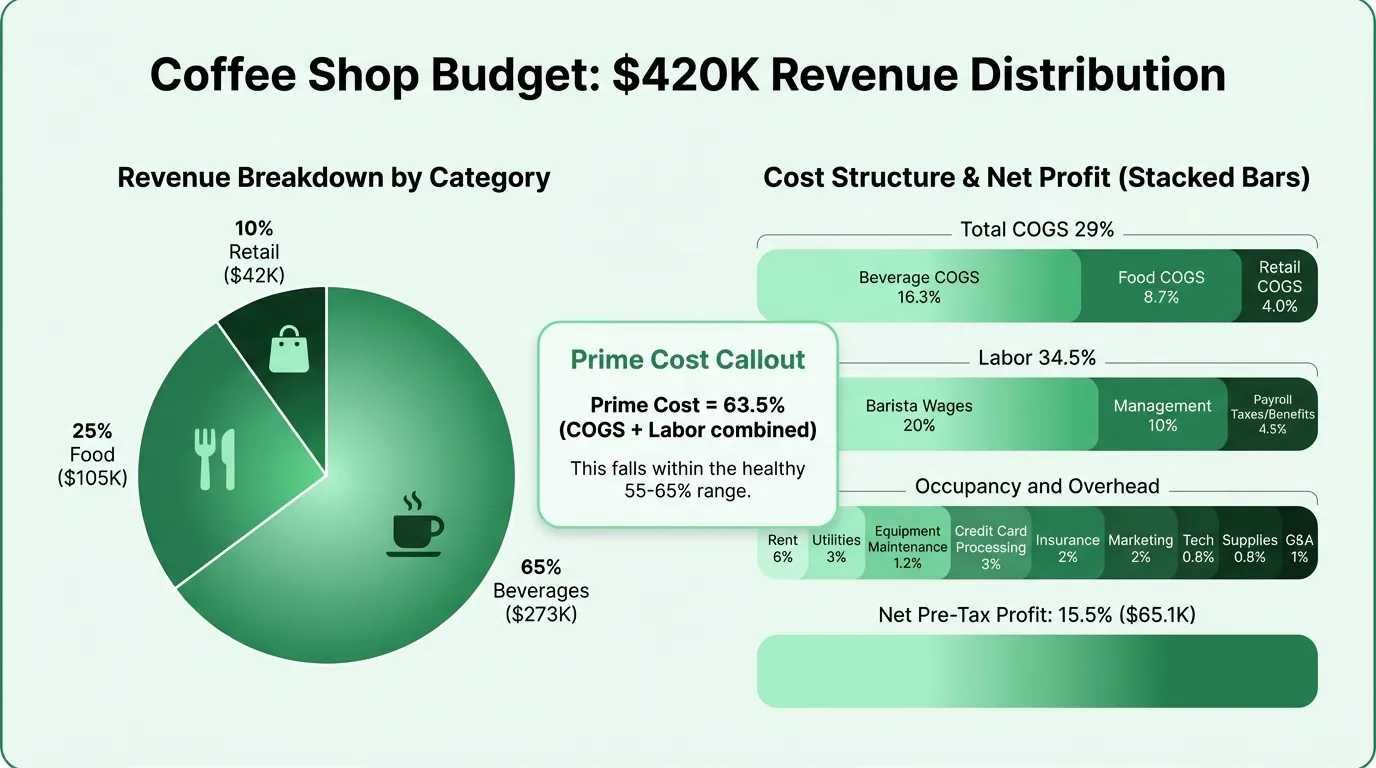
Here's a realistic budget for a well-run independent coffee shop doing $420,000 in annual revenue:
Revenue
| Category | Amount | % of Revenue |
|---|---|---|
| Beverages | $273,000 | 65% |
| Food (pastries, sandwiches) | $105,000 | 25% |
| Retail (beans, merchandise) | $42,000 | 10% |
| Total Revenue | $420,000 |
Cost of Goods Sold
| Category | Amount | % of Revenue |
|---|---|---|
| Beverage cost (25% of bev sales) | $68,250 | 16.3% |
| Food cost (35% of food sales) | $36,750 | 8.7% |
| Retail cost (40% of retail sales) | $16,800 | 4.0% |
| Total COGS | $121,800 | 29.0% |
Labor
| Category | Amount | % of Revenue |
|---|---|---|
| Barista and hourly wages | $84,000 | 20.0% |
| Management salaries | $42,000 | 10.0% |
| Payroll taxes and benefits | $18,900 | 4.5% |
| Total Labor | $144,900 | 34.5% |
Prime Cost: $266,700 (63.5% of revenue)
Occupancy and Overhead
| Category | Amount | % of Revenue |
|---|---|---|
| Rent | $25,200 | 6.0% |
| Utilities | $12,600 | 3.0% |
| Equipment maintenance and filtration | $5,040 | 1.2% |
| Credit card processing | $12,600 | 3.0% |
| Insurance | $8,400 | 2.0% |
| Marketing and loyalty | $8,400 | 2.0% |
| POS and tech subscriptions | $3,360 | 0.8% |
| Supplies and smallwares | $3,360 | 0.8% |
| Music licensing and G&A | $4,200 | 1.0% |
| Contingency | $5,040 | 1.2% |
| Total Overhead | $88,200 | 21.0% |
Net Pre-Tax Profit: $65,100 (15.5% of revenue)
This example reflects a well-operated independent shop with reasonable rent and consistent COGS control. Real results vary significantly — shops with higher rent relative to sales, or labor above 35%, often land at 5–10% net margin. The NCA's 2024 National Coffee Data Trends data shows specialty coffee consumption has surpassed traditional coffee for the first time, which supports premium pricing. But that opportunity only translates to profit if the underlying cost structure is tight.
Prime Cost for Coffee Shops
Prime cost — beverage and food COGS combined with total labor — should land at 55–65% of revenue for a sustainable coffee shop operation.
At the NRA benchmark for full-service restaurants (68–69% prime cost), there's barely enough left to cover rent, utilities, and overhead at a profit. Coffee shops face the same math. A 63–65% prime cost leaves 35–37% to cover occupancy, equipment, insurance, marketing, and profit. A 70% prime cost leaves only 30% — and once you subtract rent (6%), utilities (3%), and the rest of overhead, you're at or below breakeven.
If your prime cost is consistently above 65%, the fix is usually one of two things: beverage COGS is too high (pricing hasn't kept pace with input costs), or labor isn't scheduled tightly enough around peak hours. The coffee shop break-even calculator shows exactly how many drinks per day you need at your current cost structure.
Monthly Budget Distribution
Coffee shops have pronounced seasonal patterns, but the daily and weekly dynamics matter just as much.
January and February tend to be the slowest months for most independent coffee shops (fewer commuters, holiday spending hangover). May through September sees pickup in foot traffic in many markets. November and December are strong — holiday drink specials, gifting of beans and equipment, and office party catering.
Don't budget equal revenue for each month. Use your prior-year POS data to calculate each month's revenue as a percentage of your annual total, then apply those percentages to your forward projections. If January historically runs at 70% of your monthly average, budget 70% — not the average.
This also affects COGS and labor: food ordering quantities and staffing levels should adjust with projected volume, not stay fixed throughout the year.
The Budget-to-Actual Review
The budget only creates value when you compare it against actual results each month. Pull your POS reports and accounting system summary, place them next to the budget line by line, and calculate the variance.
The most important comparisons for a coffee shop:
Beverage COGS % — if this climbs above 30%, investigate immediately. Common causes: supplier price increases not yet reflected in menu pricing, recipe drift (baristas adding extra shots or over-pouring), or non-dairy alternative mix shifting upward without a price adjustment.
Labor % of revenue — if labor climbs above 35%, check whether the morning peak is overstaffed or whether afternoon cuts aren't happening consistently. Overtime is a common hidden driver.
Rent as % of actual revenue — if actual revenue comes in 15% below budget, your rent percentage moves from 6% to 7%, and every other fixed cost percentage climbs with it. A slow month compresses margins from both directions simultaneously.
The Coffee Shop Budget Template has the budget-vs-actual comparison built in — enter your monthly P&L data and the variances calculate automatically.
Common Coffee Shop Budgeting Mistakes
Budgeting from optimistic projections instead of comparable data. Research what similar shops in similar locations actually do. An experienced operator or a commercial real estate broker can tell you what comparable-footprint locations generate. Build your budget around realistic comparable volume, not your aspirational ceiling.
Not splitting beverage and food COGS. A blended COGS number hides the performance of each category. If your food items are running 45% COGS and beverages are running 22%, you can see which side needs attention. One blended number masks both.
Forgetting equipment maintenance until something breaks. Set aside $150–$250 per month specifically for machine maintenance and water filtration. It feels like waste when the machine is running fine. It feels like foresight when it's not.
Treating the high gross margin on beverages as profit. A latte with a 75% gross margin still needs to cover rent, labor, equipment, insurance, and overhead before it contributes to net profit. The beverage margin is the starting point, not the finish line.
If you're also tracking week-to-week cash, the cash flow view is a different tool than the budget. The budget tells you whether you're profitable over the month; cash flow tells you whether you can cover payroll and vendor payments this week. For both, starting with pre-built, coffee-shop-specific categories saves significant setup time — see the Coffee Shop Budget Template for the full structure. The Coffee Shop Cash Flow Template handles the weekly cash view alongside the monthly budget.
Last updated: March 26, 2026
Frequently Asked Questions
Related Articles
Church Budget Example: Categories, Percentages, and What to Include
A practical church budget example with real percentages for staff, facilities, missions, and programs — plus the line items most churches overlook.
Construction Budget Example: Line Items, Percentages, and What to Include
A practical construction budget example covering hard costs, soft costs, overhead allocation, and the line items most contractors underestimate.
Daycare Budget Example: Categories, Benchmarks, and What to Watch
A practical daycare budget example covering revenue sources, expense ratios, occupancy thresholds, and the line items that determine whether a center stays financially viable.
Event Planning Budget Example: Real Numbers for Your Business
A practical event planning budget example covering agency overhead, per-event costs, revenue models, and the benchmarks every planner needs to protect margins.
Hotel Budget Example: Departments, Benchmarks, and Real Numbers
A practical hotel budget example covering the USALI department structure, labor benchmarks, GOP targets, and the line items independent hoteliers most often miss.
What Is a Good Landscaping Budget? Benchmarks and Examples
A landscaping business budget breakdown covering labor, materials, equipment, overhead benchmarks, and the margin targets that separate profitable companies from struggling ones.